Figure 4.
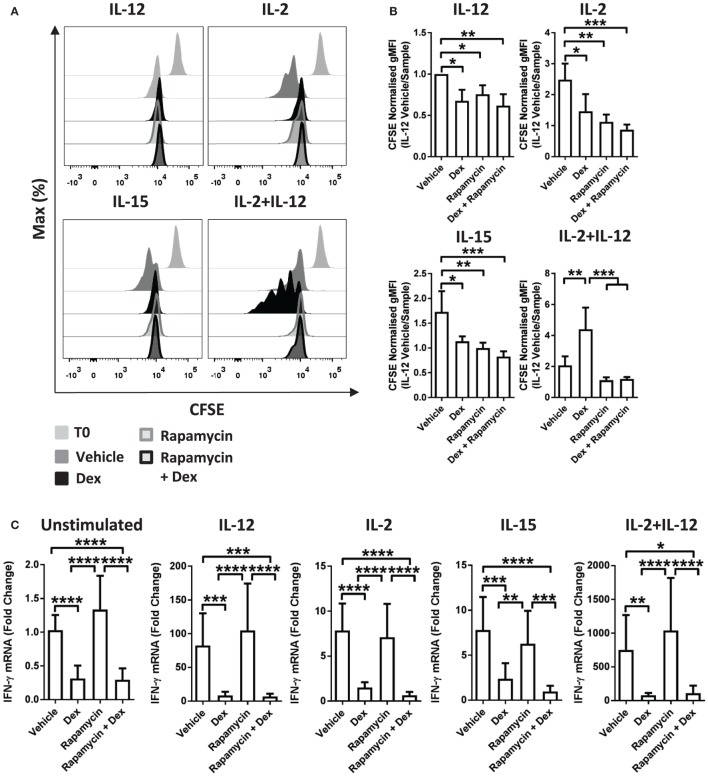
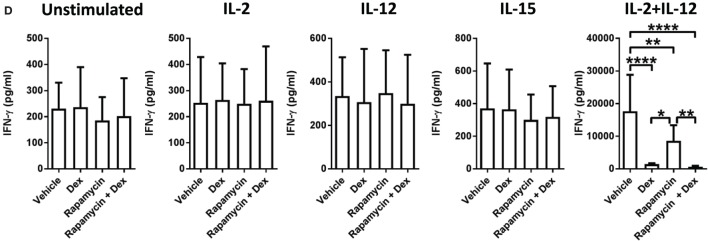
Immunosuppressive effects of glucocorticoids are not dependent on enhanced proliferation. (A,B) Primary human NK (pNK) cells were first labeled with CFSE (0.5 µM) and then treated with DMSO, as a vehicle control, or Dex (100 nM) for 1 h. Natural killer (NK) cells were then treated with rapamycin (10 nM), as indicated, and cultured for 5 days with either interleukin-12 (IL-12) (10 ng/ml), interleukin-2 (IL-2) (200 U/ml), interleukin-15 (IL-15) (5 ng/ml), or IL-2 + IL-12. Proliferation was assessed by flow cytometry. (A) Representative histograms (gated on live CD56+ pNK cells) and (B) quantification of geometric mean fluorescence intensity, normalized to IL-12 vehicle, are shown. Graphs (mean ± SD) depict four independent experiments. (C,D) pNK cells pretreated for 1 h with a vehicle control or Dex (100 nM) were treated with rapamycin (10 nM) and left unstimulated or stimulated with either IL-12 (10 ng/ml), IL-2 (200 U/ml), IL-15, or IL-2 + IL-12 for 18 h. (C) Interferon-γ (IFN-γ) gene expression was determined by RT-qPCR. Data are normalized to glyceraldehyde-3-phosphate dehydrogenase and displayed as a fold change over the unstimulated vehicle control (mean ± SD), for five (unstimulated), five (IL-12), four (IL-2), four (IL-15), or four (IL-2 + IL-12) independent experiments. (D) IFN-γ secretion was quantified by enzyme-linked immunosorbent assay. Graphs (mean ± SD) depict six (unstimulated), four (IL-12), four (IL-2), three (IL-15), or five (IL-2 + IL-12) independent experiments. Samples are compared by one-way analysis of variance (*p < 0.05; **p < 0.005; ***p < 0.0005; ****p < 0.0001). For simplicity, only significant results are labeled. T0 denotes initial CFSE stain.


