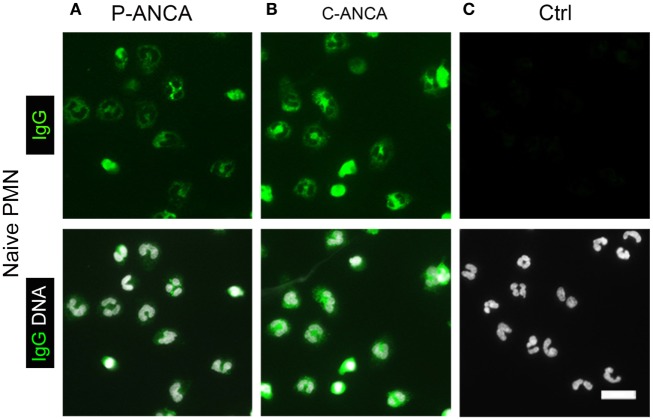
Figure 2.
P-ANCAs and C-ANCAs stain the cytoplasm of unstimulated neutrophils. (A–C) Staining of naïve neutrophils. Top panel shows human IgG staining (green), and bottom panel shows overlay of human IgG (green) and DNA staining (white). DNA staining of unstimulated neutrophils shows lobulated nuclei. Bar represents 20 µm. (A) Naïve neutrophils incubated with P-ANCA-positive sera and (B) C-ANCA-positive sera give a cytoplasmic staining pattern. (C) No staining was observed with autoantibody-negative sera (Ctrl). Images are representative of at least three independent experiments.

