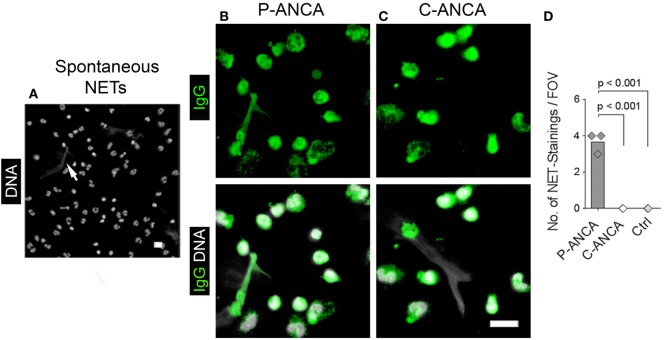
Figure 3.
P-ANCAs but not C-ANCAs bind to spontaneously formed neutrophil extracellular traps (NETs). (A–C) Staining of spontaneously formed NETs. Bar represents 20 µm. (A) DNA staining (white) shows nuclei of neutrophils and spontaneously formed NETs (arrow). Bar represents 20 µm. (B,C) Top panel shows human IgG staining (green), and bottom panel shows overlay of human IgG (green) and DNA staining (white). (B) P-ANCA positive sera stained a spontaneously formed NET shown in panel A along with the cytoplasm of naïve cells. (C) C-ANCA positive sera stained the cytoplasm of naïve cells only. Bar represents 20 µm. (D) Quantification of the number of NET stainings per field of view (FOV) in naïve neutrophils incubated with P-ANCAs (n = 3), C-ANCAs (n = 3), or autoantibody-negative sera (Ctrl, n = 3). p-Values were calculated using one-way-ANOVA followed by Tukey’s multiple comparison test.

