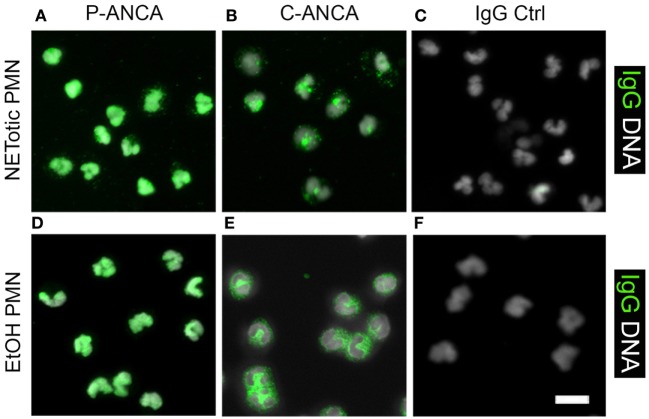
Figure 8.
Comparison of anti-neutrophil cytoplasmic antibody (ANCA) stainings on ethanol-fixed neutrophils and NETotic neutrophils. Overlay of DNA staining (white) and human IgG staining (green). (A–C) Staining of NETotic neutrophils. (A) P-ANCA positive sera stain the nucleus of NETotic neutrophils. (B) C-ANCA positive sera stain the cytoplasm of NETotic cells. (C) Staining with autoantibody-free sera (IgG Ctrl) did not stain the cells. (D–F) Staining of ethanol-fixed naïve neutrophils with ANCA-positive sera. (D) P-ANCA positive sera stain the nucleus of ethanol-fixed naïve neutrophil. (E) C-ANCA positive sera stain the cytoplasm. (F) Staining with autoantibody-free sera (Ctrl) did not stain the cells. Images are representative of at least three independent experiments. Bar represents 50 µm.

