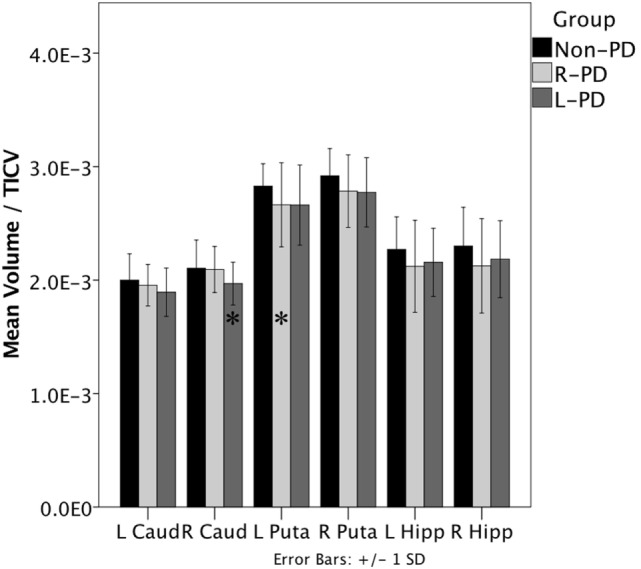
Figure 1.

Right-onset Parkinson’s disease (PD) (n = 45) and left-onset PD (n = 27) versus non-PD (n = 48) volumetric differences. Note: all values are the group mean ratios of structure volume relative to total intracranial volume (TICV). Error bars indicate ±1 SD. *Indicates L-PD or R-PD < non-PD, p ≤ 0.05.
