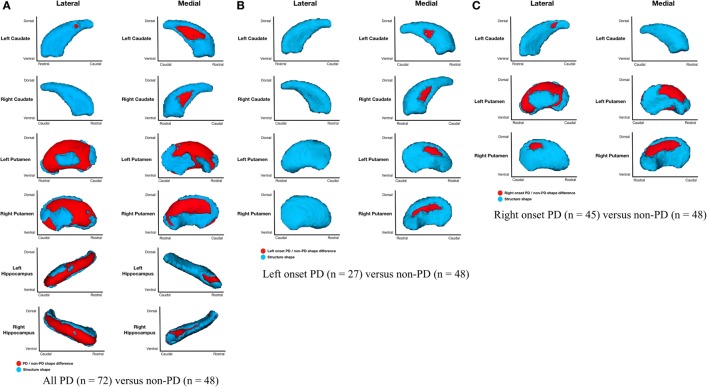
Figure 2.
Parkinson’s disease (PD) and non-PD subcortical shape considering volume differences. Note: areas in red indicate where groups are significantly different (FDR-corrected p < 0.05). Areas in red indicate significant F-values, which in this case are all areas of atrophy (inward vertex displacement) in PD relative to non-PD peers. Relative to non-PD, L-PD have more right than left putamen and caudate nucleus atrophy and R-PD have more left than right putamen and caudate nucleus atrophy (see Table 3). (A) All PD (n = 72) versus non-PD (n = 48); (B) left onset PD (n = 27) versus non-PD (n = 48); (C) right onset PD (n = 45) versus non-PD (n = 48).

