Figure 2.
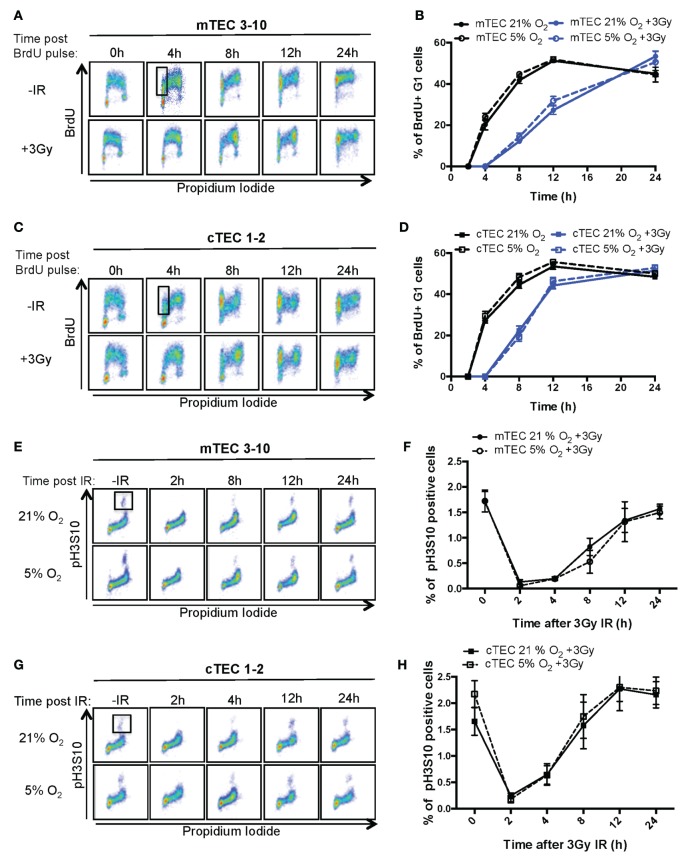
Thymic epithelial cell (TEC) cell cycle regulation and checkpoint analysis. Cytograms of (A) mTEC 3–10 and (C) cTEC 1–2 cells stained for bromodeoxiuridine (BrdU) incorporation and DNA content (propidium iodide) cultured in 21% at different time points following BrdU pulse, with or without treatment with 3 Gy of ionizing radiation (IR). Representative gating strategy for the identification of BrdU+ G1 cells is shown in black. Quantification of average percentage of BrdU-labeled G1 phase cells in (B) mTEC 3–10 and (D) cTEC 1–2 cells cultured in either 21 or 5% O2, 0–24 h post BrdU pulse, with or without treatment with 3 Gy of ionizing radiation (IR). Cytograms of (E) mTEC 3–10 and (G) cTEC 1–2 cells stained for histone H3 Ser10 phosphorylation (pH3S10) and DNA content (propidium iodide) in 21 or 5% O2 at different time points following treatment with 3 Gy of IR. Representative gating strategy for the identification of pH2S10+ cells is shown in black. Quantification of average mitotic index (% of pH3S10 positive cells) in (F) mTEC 3–10 and (H) cTEC 1–2 cells, 0–24 h postirradiation.

