Figure 5.
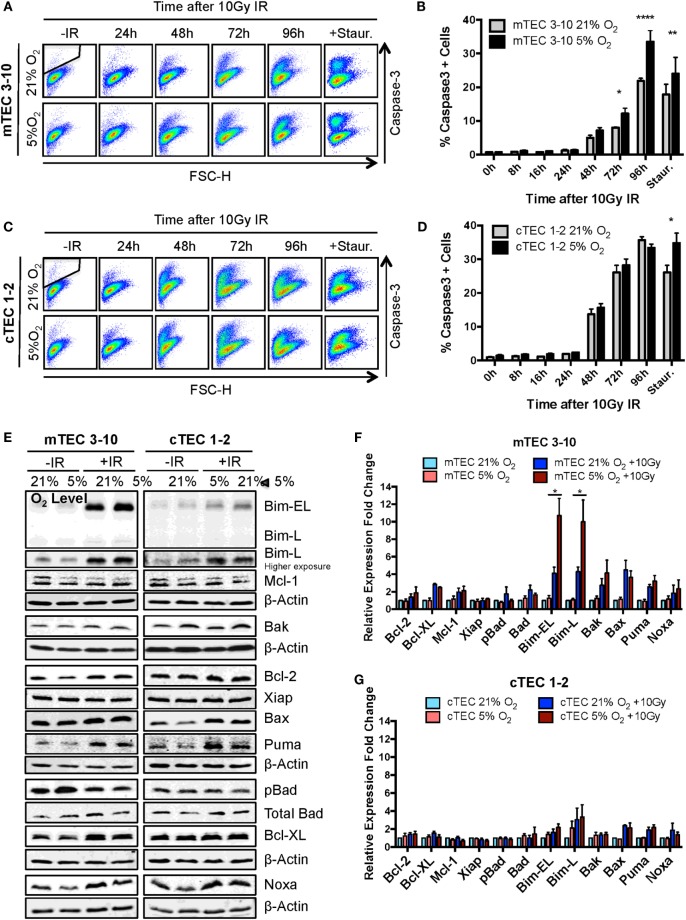
Ionizing radiation (IR)-induced apoptosis analysis in thymic epithelial cells (TECs). (A) Representative cytograms of mTEC 3–10 cells stained for cleaved Caspase-3, and (B) quantification of average percentage of Caspase-3 positive mTEC 3–10 cells, 0–96 h post 10 Gy of IR. Staurosporin treatment was used as a positive control for the activation of the apoptosis pathway. Representative gating strategy for the identification of Caspase-3+ cells is shown in black. *p < 0.05, **p < 0.01, ****p < 0.0001 compared to normoxic samples, two-way ANOVA, n = 4. (C) Representative cytograms of cTEC 1–2 cells stained for cleaved Caspase-3, and (D) quantification of average percentage of Caspase-3 positive cTEC 1–2 cells 0–96 h following treatment with 10 Gy of IR. *p < 0.05, **p < 0.01, ****p < 0.0001 compared to normoxic samples, two-way ANOVA, n = 4. (E) Representative western blots and quantification of (F) mTEC 3–10 and (G) cTEC 1–2 expression level of pro- and anti-apoptotic proteins. β-Actin was used as reference gene for the quantification and all values were normalized against the untreated normoxic samples. *p < 0.05, multiple t-tests with Holm–Sidak posttest correction, n = 4.

