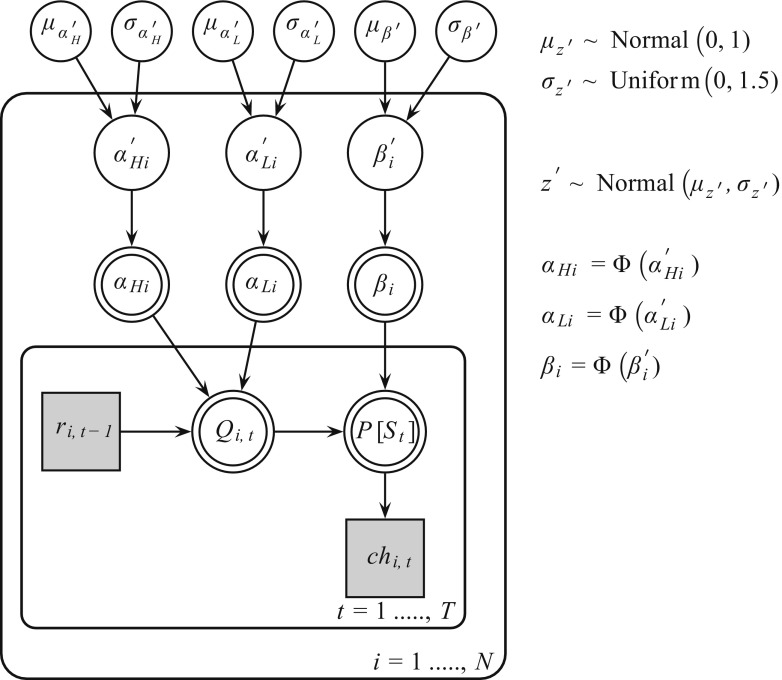
Fig. 2.
Bayesian graphical Q-learning model for hierarchical analysis. Φ () is the cumulative standard normal distribution function. The model consists of an outer subject (i = 1…,N), and an inner trial plane (t = 1,…,T). Nodes represent variables of interest. Arrows are used to indicate dependencies between variables. Double borders indicate deterministic variables. Continues variables are denoted with circular nodes, and discrete with square nodes. Observed variables are shaded in gray

