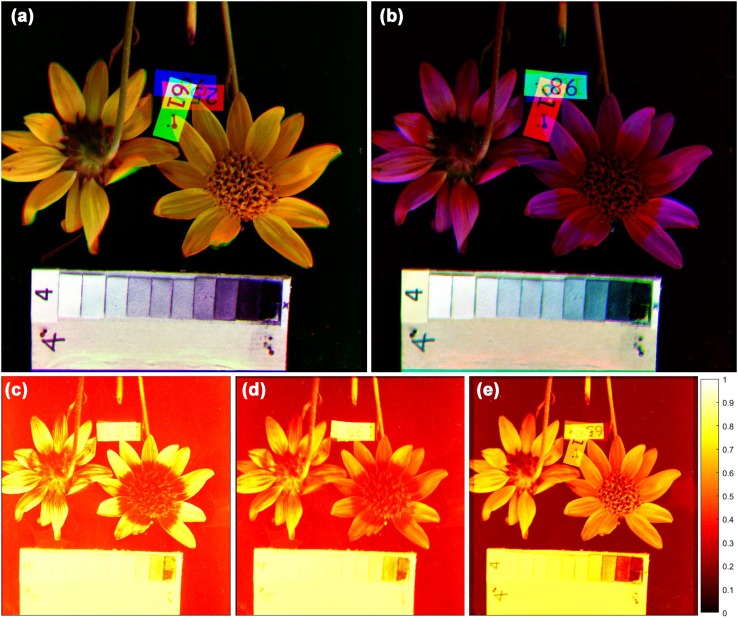
Fig. 1.
Example of the image analysis (Arnica mollis). Black-and-white photographs were taken through a series of monochromatic filters (Kevan 1972) with peak transmissions at 340, 400, 460, 520, 580, 640 and 700 nm. The photographs have been corrected for white balance based on gray scales. We tinted the black-and-white images to the appropriate hue and combined them to result in a false color image. For human vision (a), we combined the blue, green and red layers; for bees (b), we transformed yellow, blue and ultraviolet (invisible to human observers), into red, green and blue. We then calculated the dimensionless receptor responses of the short- (c), medium- (d) and long-wavelength receptors (e) that describe the electrical signals the bees’ photoreceptors would produce in response to the image. Response values are represented by the brightness of each pixel in the heat maps

