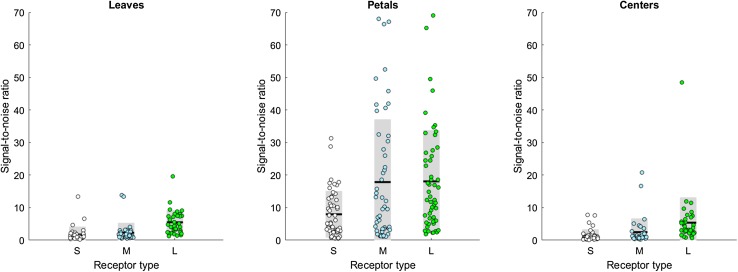
Fig. 3.
The signal-to-noise ratio is the largest in the long-wavelength channel. From each of the 53 images in our multispectral database, we selected areas that contained leaves (34 images), petals (52 images) and areas where the nectar and the stamens/carpels can be found (centers, 38 images). From each area, we randomly chose 1000 pixels and calculated the photoreceptor responses to the selected pixels. Finally, we calculated the signal-to-noise ratio (SNR) of each area as the mean of receptor responses divided by their standard error. The dots represent the individual SNRs of each area of each flower species, the black lines indicate their means and the gray areas depict the standard deviations. The signal content varies between the different parts of flowering plants—with petals giving nearly an order of magnitude better signal than leaves and centers—but in all cases the long-wavelength receptors provide the most reliable signal with the highest SNR. (Mean ± SD, leaves: S = 1.73 ± 2.40, M = 2.29 ± 2.97, L = 5.49 ± 3.69; petals: S = 7.96 ± 7.09, M = 17.84 ± 19.23, L = 18.08 ± 15.67; centers: S = 1.41 ± 1.87, M = 2.48 ± 4.17, L = 5.39 ± 7.73; Kruskal–Wallis tests P leaves < 0.001, P petals < 0.001, P centers < 0.001; Wilcoxon signed-rank tests, all pairwise comparisons P < 0.001 except for P petals,M vs L = 0.32)

