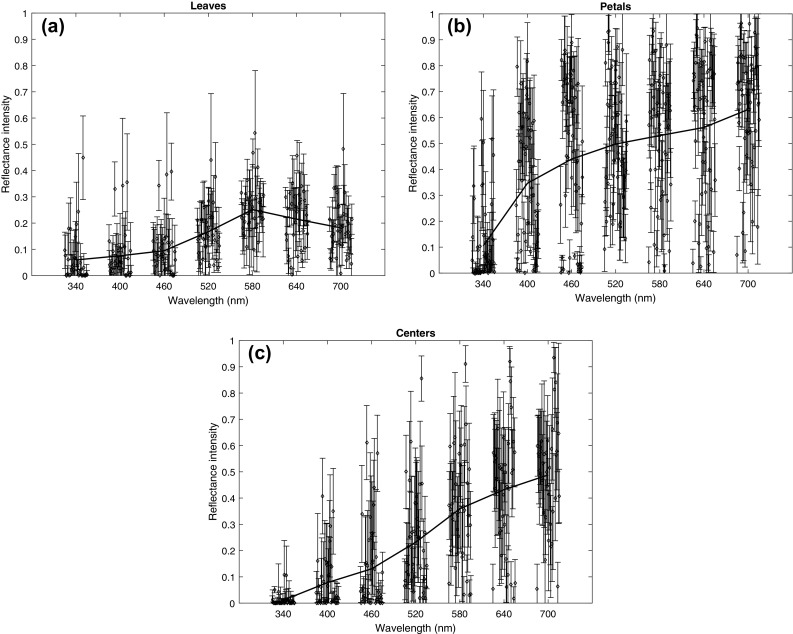
Fig. 5.

Reflectance properties of leaves, petals and centers. From each of the 53 images in our multispectral database, we selected areas that contained leaves (34 images), petals (52 images) and areas where the nectar and the stamens/carpels can be found (centers, 38 images). From each area, we randomly chose 1000 pixels, and for each of the seven layers, we plotted the mean and standard deviation of their reflectance intensities. The graphs also show the mean of means (thick line), i.e., the spectral reflectance function of the ‘average’ leaf (a), petal (b) or center (c). All areas reflect more of long-wavelength light. Standard deviations of reflectance intensities either increase or remain similar, but never decrease with increasing wavelength
