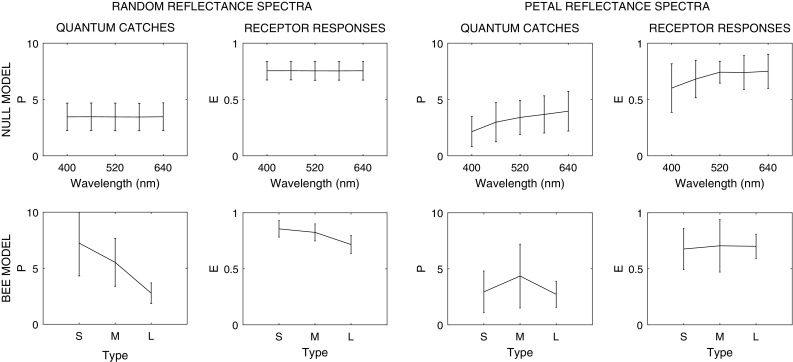
Fig. 6.

Particulars of the bee eye and flower colors jointly lead to differences in receptor response statistics. The ‘null model’ uses unit background reflectance, unit illumination and unit receptor sensitivities in the calculations (see Supplementary Material, Table S3); the ‘bee model’ uses the receptor sensitivities of bees, the average leaf spectrum as background and the D65 spectrum as illumination. We run both models on 10,000 spectra with randomly generated reflectance intensities (‘random reflectance spectra’) and on the reflectance spectra of the petals from the multispectral photos (‘petal reflectance spectra’) and then plotted the mean and the standard deviations of quantum catches (P) and relative receptor responses (E). As expected, when the null model is tested on random reflectance spectra, neither quantum catches nor relative receptor responses change alongside the peak sensitivities of the receptors (wavelength). For actual petal colors, the null model produces quantum catches and relative receptor responses whose mean increases with increasing peak sensitivity, while the smallest standard deviations appear at peak sensitivity of 520 nm. In the full ‘bee model,’ in response to random reflectance spectra, the mean quantum catches and their standard deviations steeply decrease as the receptors’ peak sensitivity shifts from short- to medium- and then to long-wavelength (type), due to the shape of the receptor sensitivity curves. The nonlinear transformation of P to E, however, brings the means closer and leads to similar standard deviations. The last two panels show the quantum catches and receptor responses of the bee eye to actual petal colors (note that the receptor responses describe the same data that is plotted on the second panel of Fig. 3). Once all factors are taken into account, their interactions lead to mean relative receptor responses that are equally high for all three receptor types, and to smaller standard deviations in the long-wavelength receptor responses. For more details on parameter tests, see Supplementary Material, Fig. S7
