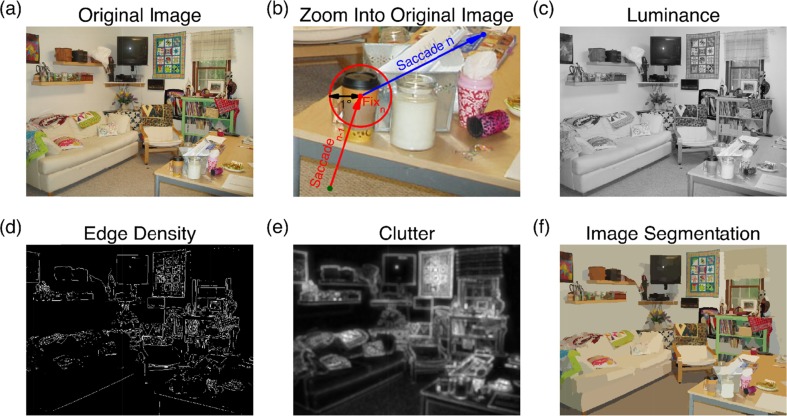
Fig. 2.
Example image and feature maps. (a) The original image. (b) Zooming in to the table on the lower right, with a fixation on the paper coffee cup. (c) Luminance map. (d) Edge density map, after filtering the image with a Sobel operator. (e) Feature congestion visual clutter map. (f) Synergistic segmentation of the scene image, resulting in 2,277 homogeneous tiles

