Fig. 1.
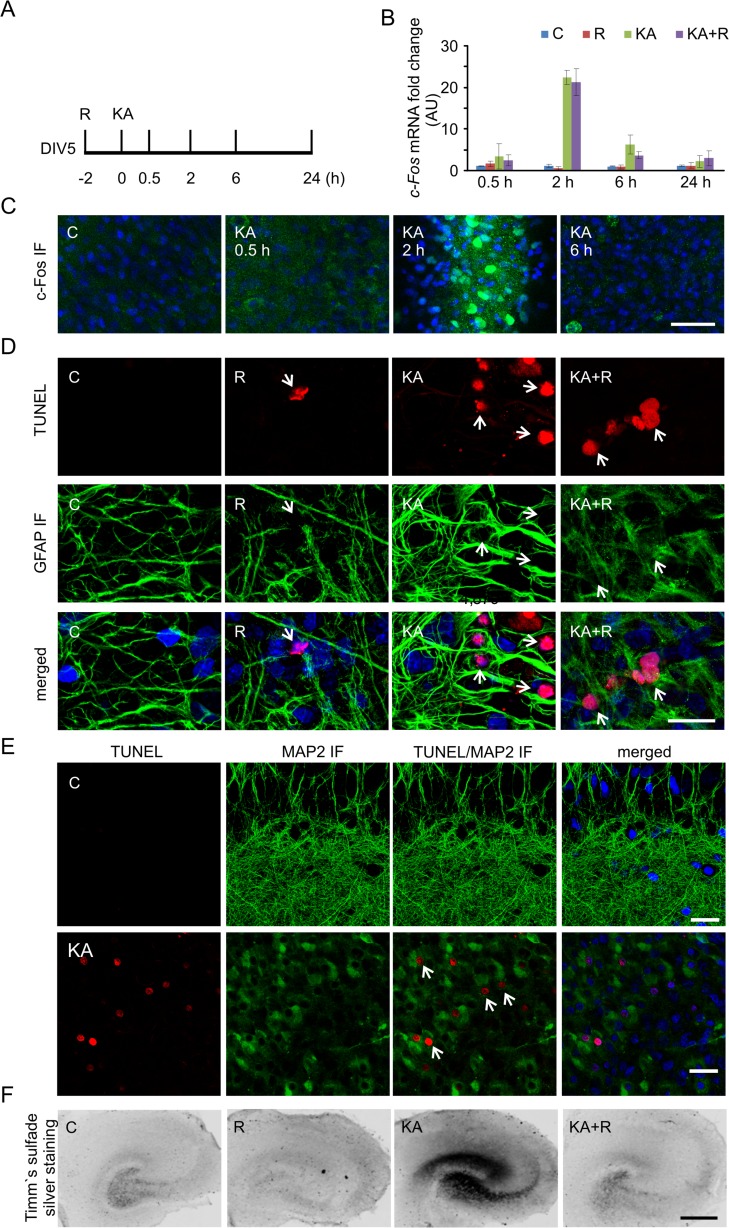
In vitro model system to study molecular and cellular responses to kainic acid. a Scheme of rat organotypic hippocampal slice treatments with kainic acid (KA) and rapamycin (R). b Expression of c-Fos mRNA after KA treatment analyzed by qRT-PCR. C control, R rapamycin, KA kainic acid, KA+R kainic acid+rapamycin. Number of cultures (N) = 3, number of slices per condition per culture = 4. c Representative confocal images of CA1/CA3 area of organotypic hippocampal slices immunofluorescently stained for c-Fos (green) after KA at the indicated time points. Nuclei were counterstained with Hoechst 33342 (blue). Scale bar = 50 μm. d Representative confocal images of CA1/CA3 area of organotypic hippocampal slice TUNEL staining (red) 24 h after indicated treatment. Slices were additionally immunofluorescently stained with the glial marker GFAP (green) and counterstained with nuclear dye Hoechst 33342 (blue). Scale bar = 20 μm. e Representative confocal images of CA1/CA3 area of organotypic hippocampal slice TUNEL staining (red) 24 h after indicated treatment. Slices were additionally immunofluorescently stained with the neuronal marker MAP2 (green) and counterstained with nuclear dye Hoechst 33342 (blue). Scale bar = 20 μm. f Representative images of organotypic hippocampal slice with Timm’s staining treated as indicated. Scale bar = 500 μm (color figure online)

