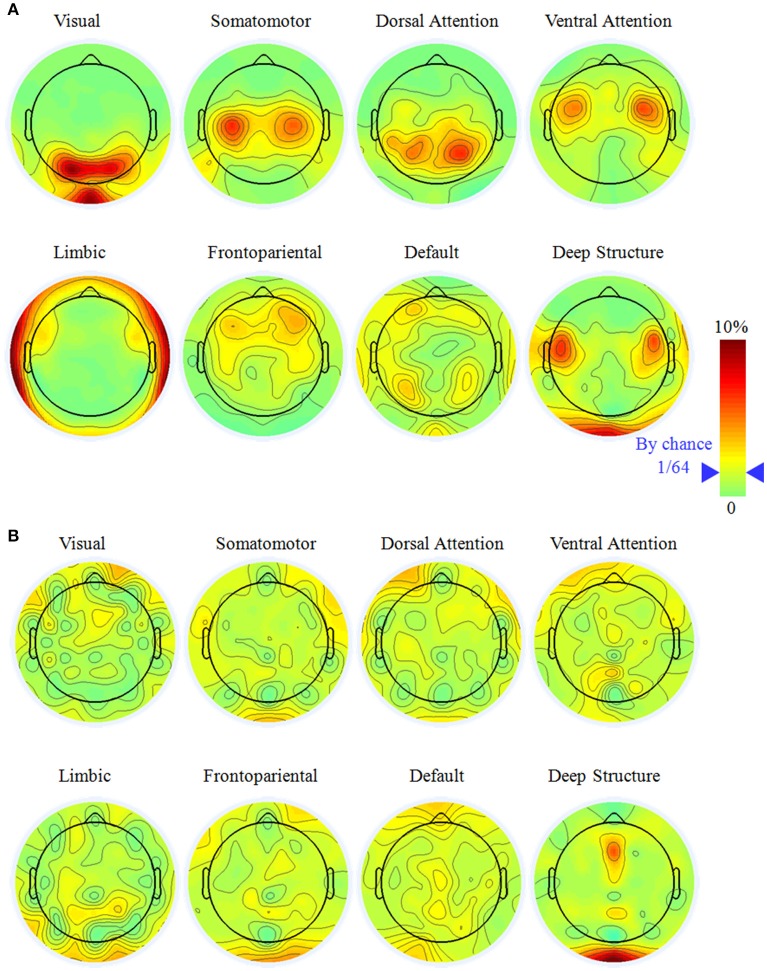
Figure 3.
The most sensitive (A) and neutral electrodes (B) for each large-scale brain network with the electrode number of 64. Notice it would be 1/64 (marked in the color bar) if all the electrodes have equal chance to be the most sensitive or neutral electrode. The most sensitive electrode had a symmetric distribution and concentrated on specific electrode while the most neutral electrode was random.

