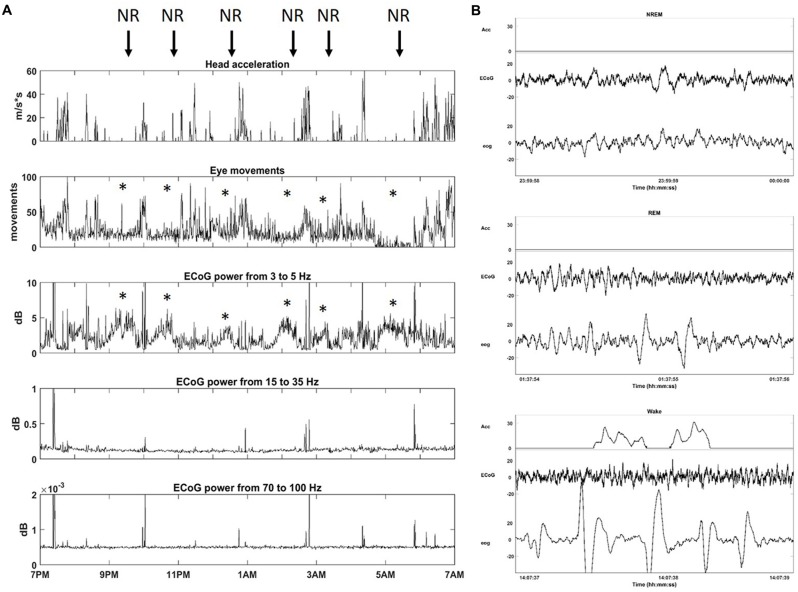
Figure 3.
Sleep architecture of monkey. (A) One night of continuous recording of sleep from 7 pm to 7 am with Neurochip2. From top to bottom: head acceleration, eye movements, power (dB) for different frequency bands: Delta (3–5 Hz), Beta (15–35 Hz), Gamma (70–100 Hz). Each plot shows the average over 30-s bins. The arrows point at non-rapid-eye-movement (NREM) sleep stages (NR) characterized by a relative higher contribution of delta oscillations to ECoG signals with a reduction in eye movements (*). (B) Example of 2-s epoch polygraph records showing, from top to bottom, NREM, rapid eye movement (REM) and Wake stage in the monkey.

