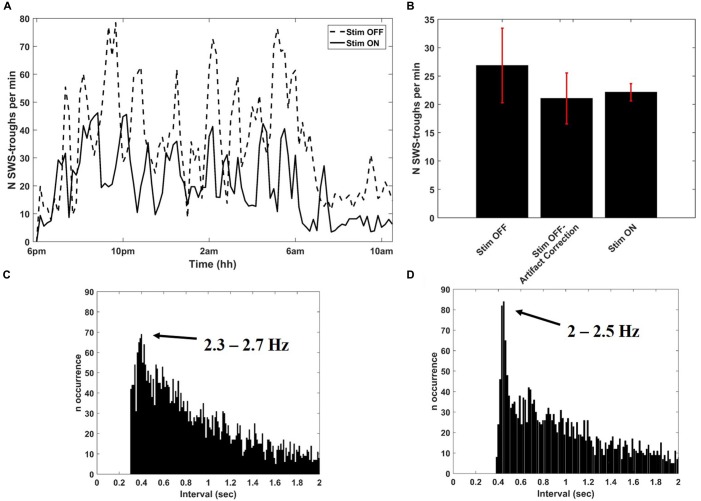
Figure 4.
Detection of SWS cycles from SWATS-area (with stimulation ON) and from contra-area (with stimulation OFF). (A) SWS cycles detected per minute as a function of night time during stimulation OFF (dotted line) and stimulation ON (solid line) collected in two different nights. (B) Average (mean ± STD) rate of identified SWS cycles during the entire night over several recordings (N = 11) for three different conditions: Stimulation OFF, Stimulation OFF with artifact correction, Stimulation ON. The distributions are not significantly different (pair-wise t-test returned p-values > 0.05 for all comparisons). (C) Inter-discrimination- interval histogram of 2 h of recording from contra-area during sleep with deletion of 300 ms after each detected cycle that would have triggered the stimulation. The peak is centered at 0.4005 s, which corresponds to 2.5 Hz. (D) Inter-stimulus-interval histogram from 2 h of SWATS-area sleep recording with stimulation ON from 9 pm to 11 pm. The peak is centered at 0.4485 s, which corresponds to 2.2 Hz.

