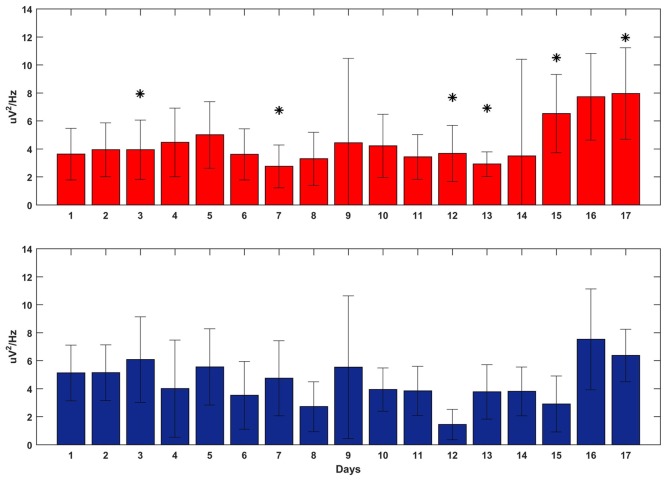
Figure 7.
Delta power at the reward onset during the execution of the BMI tasks overall 17 days of training (x-axis). SWATS-area task (top panel, red), contra-area task (bottom panel, blue). Each bar represents the average delta power over all trials (mean ± STD). The * indicates the days when the difference in power between the two tasks was significant (p-value < 0.05, Bonferroni corrected).

