
Figure 8.
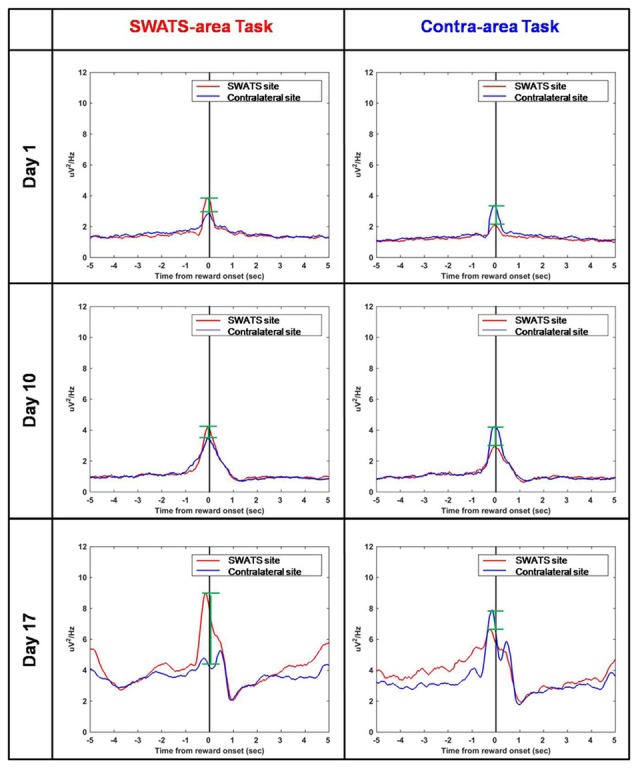
Reward-triggered average of delta power for day 1 (top), day 10 (middle) and day 17 (bottom) during SWATS-area task (left) and contra-area task (right). Red lines show the signal from SWATS electrode (conditioned hemisphere) and blue lines show the signal from contralateral electrode (non-conditioned hemisphere). X axis represents time from reward onset (black line). The green bars show the difference between the peaks of the two signals at the reward onset.