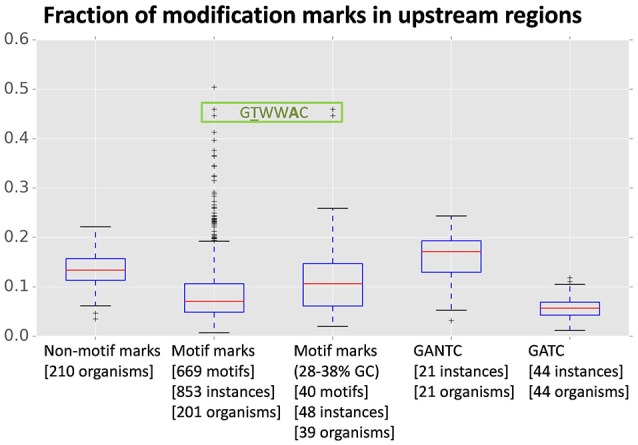
Figure 1.

Fraction of modification marks mapping to upstream regions of annotated genes across a panel of 210 methylomes. The fraction of upstream marks is relative to the sum of marks mapping to upstream, downstream, and intragenic regions of annotated genes in each genome. The boxplot columns designate different datasets: non-motif associated modification marks, motif-associated modification marks, %GC-controlled (28–38% GC) motif-associated modification marks, and marks associated with the widely distributed GTNAC and GTAC motifs. For each column, the bracketed numbers in the abscissa legend indicate the number of unique motifs in the dataset, the number of instances of those motifs identified in the complete set of methylomes and the number of organisms on which such instances were detected. The data points corresponding to the R. solanacearum GMI1000 and R. solanacearum UY031 GTWWAC motifs are boxed.
