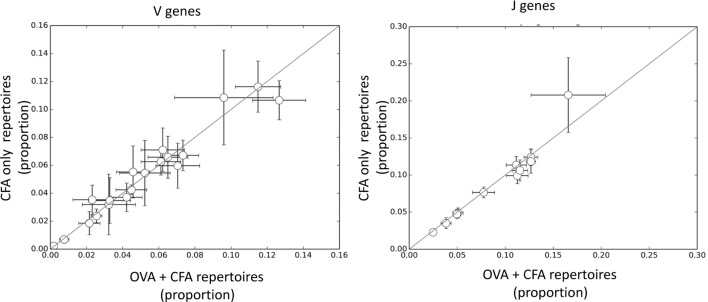
Figure 4.
The frequency of V and J genes in complete Freund’s adjuvant (CFA) versus ovalbumin (OVA) + CFA repertoires. Each dot shows the frequency of a specific V or J gene in CFA + OVA (x axis) and CFA only (y axis) repertoires. The error bars show mean ± SD calculated from 50 samples of 10,000 TCRs from each repertoire.

