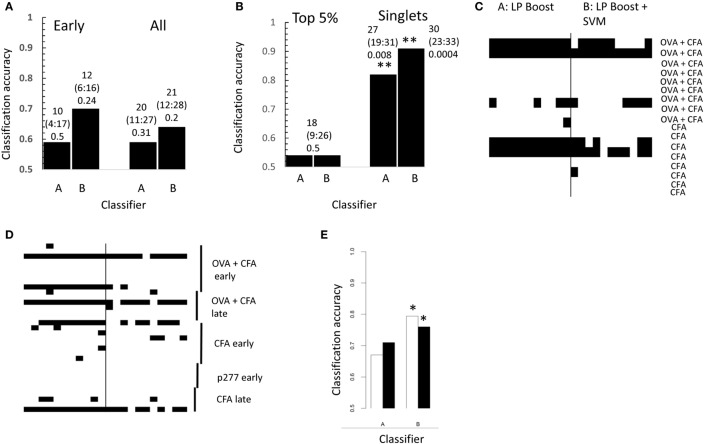
Figure 5.
(A) Performance of linear programming boosting (LPBoost) with (B) or without (A) subsequent SVM in the classification of boosting for early (left) and all (right) repertoires. The overall accuracy for each algorithm calculated by majority vote of 99 samples of CDR3s from each repertoire. The results show a trend for correct classification, but are not significantly better than random using Fisher’s exact test. The numbers above each bar show the number of correctly classified repertoires, the 95% confidence range for this estimate, and the Fisher’s exact test p value for the result. (B) As for panel (A) but using only CDR3s within the top 5% percentile of the CDR3 frequency from each repertoire (only one CDR3 sample from each repertoire could be analyzed because of limitation of sample size) or using only clones present once in each repertoire (i.e., singlets). The numbers above each bar show the number of correctly classified repertoires, the 95% confidence range for this estimate, and the Fisher’s exact test p value for the result. **p < 0.01 Fisher’s exact test. (C) The results of 11 separate subsamples of the early repertoires using singlet CDR3s as in panel (B). Each row of the heatmap represents the repertoire from one immunized mouse, which is omitted from the training set, and then used as test. Each train/test combination was carried out 11 times. Each column of the heatmap therefore represents one replicate train/test cycle. Black indicates incorrect classification. (D) As for panel (C), but for all repertoires. (E) The filled bars show classification accuracy of LPBoost algorithms on early repertoires using the set of CDR3s with expansion index >6 in any early immunized mouse (cf., Figure 2E). The empty bars show the average classification accuracy obtained from 100 sets (same size) of CDR3s drawn randomly from the combined repertories of all immunized mice. *p < 0.05 Fisher’s exact test.

