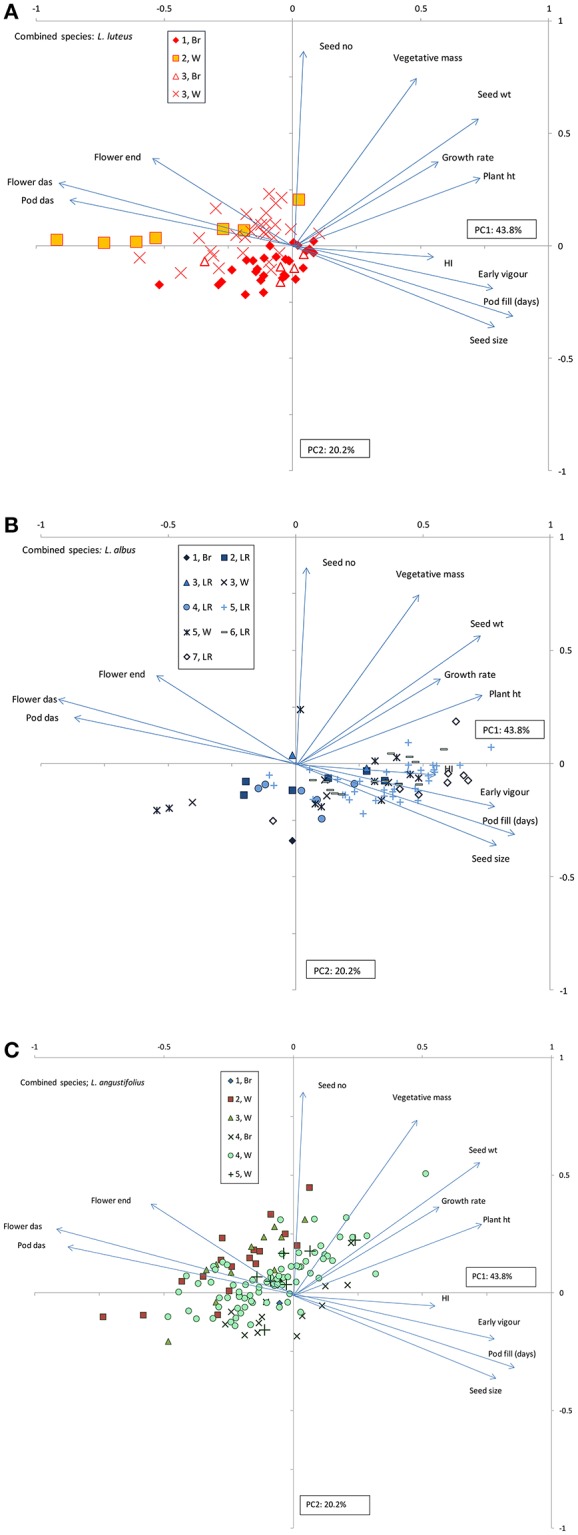
Figure 3.

Combined species principal components analysis (PCA) of old world lupin phenology, growth and productivity under rainfed field conditions in 2007. L. luteus (A), L. albus (B), and L. angustifolius (C) are plotted in 3 separate panels with identical vectors to clarify within species cluster differences. Factor loadings for PC1 and 2 are presented as vectors, abbreviated as follows: das, days after sowing; HI, harvest index; ht, height; no, number; wt, weight. Markers represent genotype scores, classified by habitat/domestication status clusters within species.
