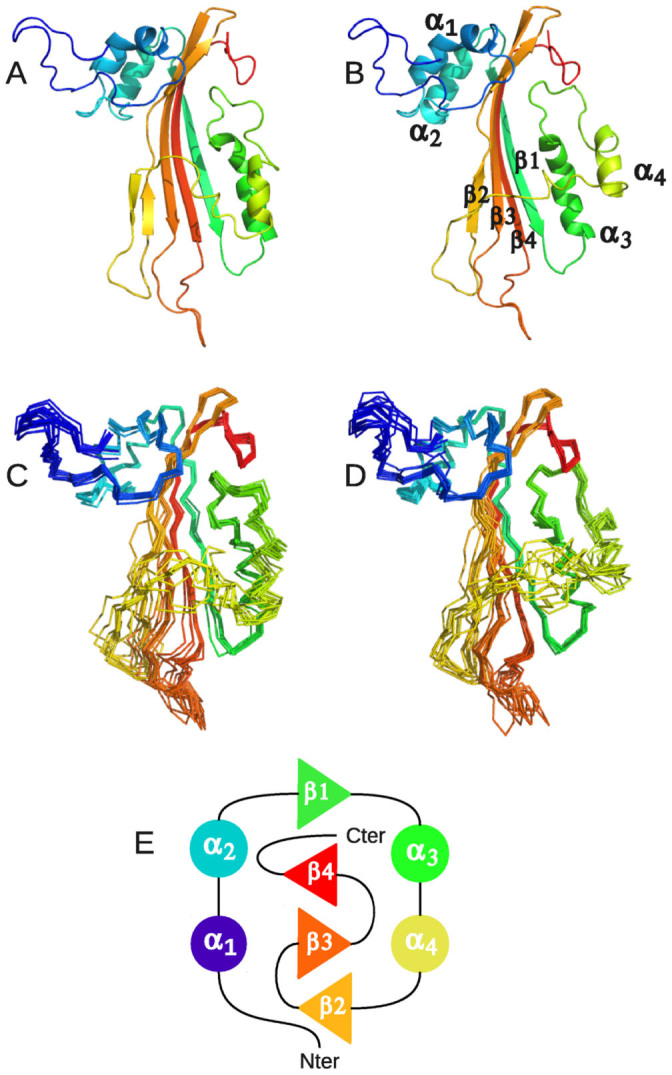
Figure 4.

Ribbon representation of model 1 (A) and 11 (B) of the NMR ensemble of CytC (2MLW.pdb). Overlay of Cα traces of models 1 to 10 (C) and 11 to 20 (D). (E) Topology diagram of CytC. Helices and strands are represented by circles and triangles respectively. Secondary structure elements are colored in rainbow starting from blue to red.
