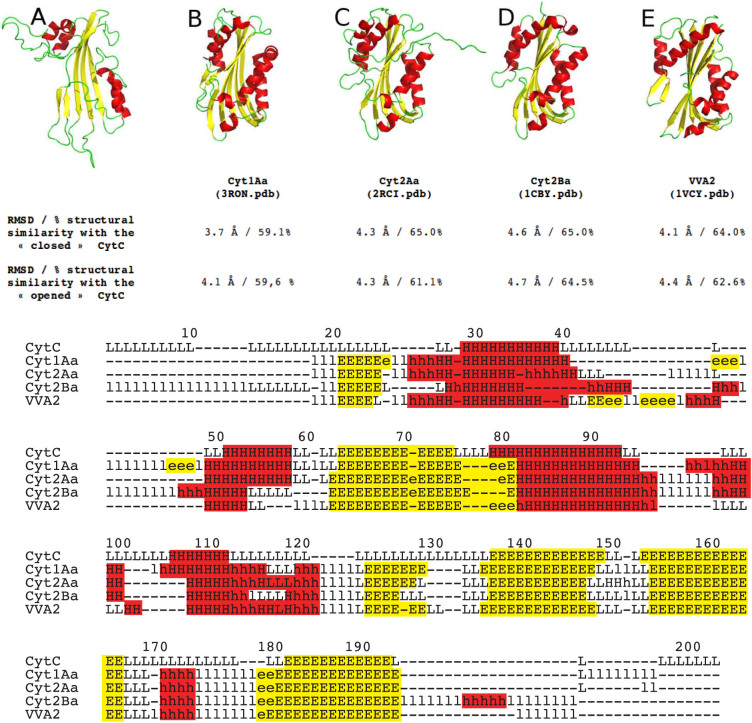
Figure 7. Ribbon representation of CytC (A), Cyt1Aa (B), Cyt2Aa (C), Cyt2Ba (D), and VVA2 (E).
Helices are represented in red and β-strands in yellow. The percentage of similarity and the RMSD of two “closed” and “opened” CytC conformations with other Cyt toxins (Cyt1Aa (B), Cyt2Aa (C), Cyt2Ba (D), and VVA2 (E) are indicated. The second part shows the secondary structure alignment (H/h: helix, E/e: strand, L/l: coil, assigned by DSSP). Uppercase means structurally equivalent positions with CytC. Lowercase means insertions relative to CytC.

