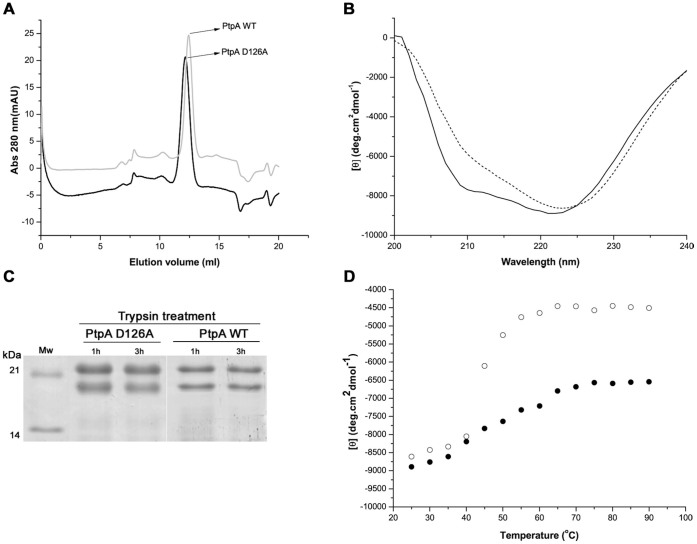
Figure 1. Structural characterization of PtpA D126A.
(A) Analysis by size exclusion chromatography of the affinity purified PtpA D126A. The analytical Superdex 75 10/300 GL column was calibrated (y = 4154.9 e−3.2757×) using SEC molecular weight markers (SIGMA).The elution volume (Ve) of native PtpA D126A and PtpA wt was 12.16 ml and 12.43 ml, corresponding to 21 kDa and 19 kDa, respectively (theoretical Mw 19.9 kDa). (B) CD spectra of PtpA wt (continuous line) in comparison with that of the mutant D126A (dashed line). These spectra represent the average of five scans performed with PtpA wt and PtpA D126A. (C) SDS-PAGE (15% gel) analysis of the trypsin-treated PtpA D126A and PtpA wt, showing the non cleaved form (~ 20 kDa) and the cleaved form of about 18 kDa; Mw, molecular weight marker. (D) Thermal denaturation curves for PtpA wt (•) and mutant PtpA D126A (o).

