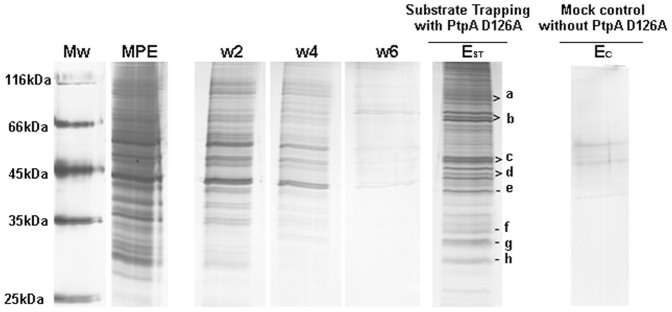
Figure 3. SDS-PAGE analysis of the samples obtained in PtpA D126A substrate trapping assays.
Mw, molecular weight marker; MPE, macrophage extract; W2, second wash (with running buffer); W4, fourth wash (with 0.5 M NaCl); W6, sixth wash (with 1.0 M NaCl). EST represents a pool of the four elutions after the substrate trapping with PtpA D126A, and EC a pool of the four elutions after the mock substrate trapping experiment (matrix without immobilized PtpA D126A). These gels are representative of two biological replicates of substrate trapping experiments performed with different batches of purified PtpA and macrophage extracts.

