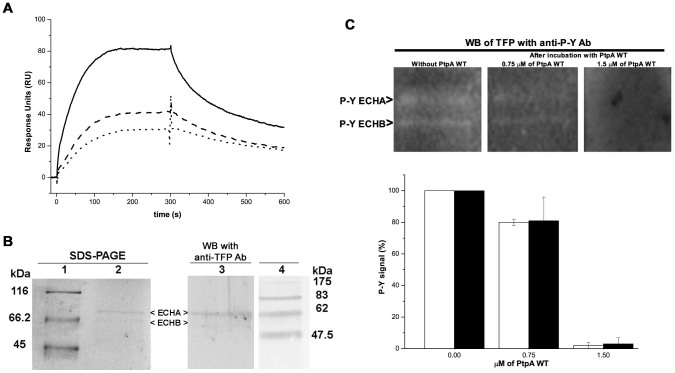
Figure 4. PtpA interacts with and dephosphorylates the TFP (ECHA/ECHB) in vitro.
(A)Real time association-dissociation sensorgrams of PtpA D126A with immobilized TFP, in absence (continuous line) and in presence of 2.5 mM (dashed line) and 5 mM (dotted line) of Na3VO4. PtpA D126A was injected at 5 μM, diluted in running buffer at 25°C, during 5 minutes and a flow rate of 30 μl/min. These sensorgrams are representative of the results obtained in two analytical replicates and two biological replicates performed with different batches of TFP and PtpA D126A. (B)Immunodetection of the TFP (ECHA and ECHB subunits). Left, SDS-PAGE stained with Colloidal Coomassie with MW (lane 1) and the TFP enriched fraction (lane 2). Right, Western blot with the anti TFP (ECHA/ECHB) antibody on the same TFP enriched fraction (lane 3), and the MW (lane 4). Immunodetection of P-Y signal in the TFP (ECHA/ECHB) after incubation with 0, 0.75 and 1.5 μM of PtpA wt. The bands were quantified using the GBOX ChemiSystem tool (SynGene), using the raw volume as index of the signal. The P-Y signal obtained after incubation of the TFP with PtpA wt at 0.75 and 1.5 μM was normalized to the signal obtained with PtpA wt at 0 μM (considered as 100%). Error bars represent inter-experimental variability detected in two experiments using two different batches of immunoprecipitated TFP. In the online resource PhosphoSitePlus ECHA is noted as phosphorylated in Y724 and ECHB in Y336, Y342 and Y35734.

