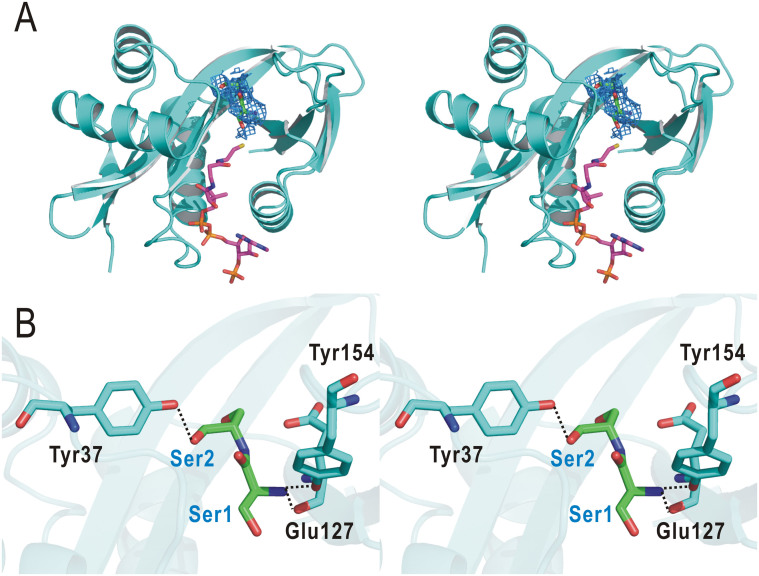
Figure 5. The interaction of SsArd1 with Alba substrate peptide.
(A) Stereo representation of the crystal structure of SsArd1 complex with CoA (magenta) and peptide (green). A Fo - Fc omit electron density map (prior to modeling the ligand) is contoured at the 2.0 σ level (blue). (B) Stereo diagram of a stick representation of the interaction between the SsArd1 and peptide. Substrates are in green and numbered 1–2 sequentially from the N-terminus. Hydrogen bonds are depicted as black dashed lines.

