Figure 6.
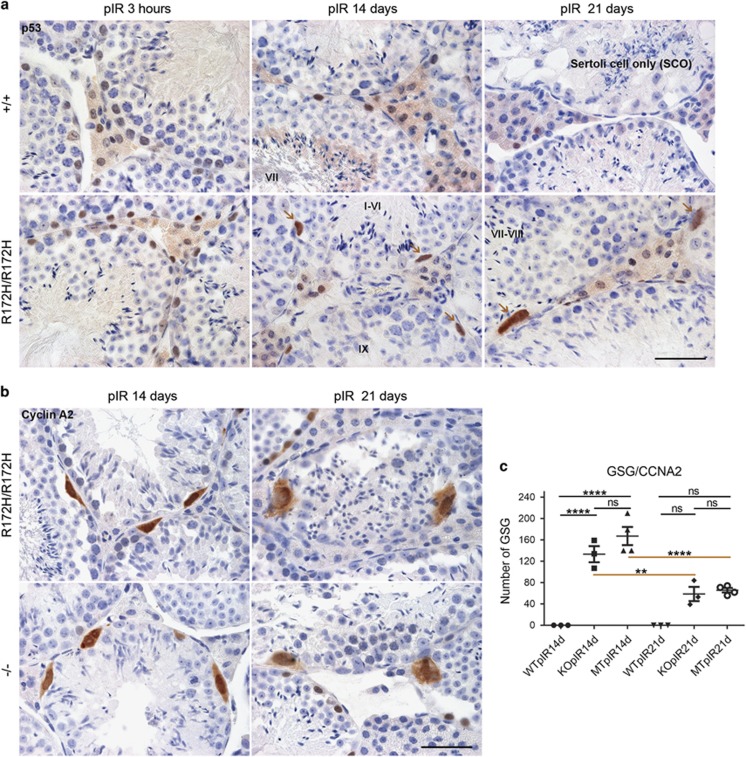
The formation of giant spermatogonia triggered by DSBs in p53R172H and p53-null mice. (a) p53 IHC of testes from p53+/+ and p53R172H/R172H mice irradiated with 2 Gy and sacrificed at 3 h, 14 days and 21 days post irradiation (pIR). Brown arrows: giant spermatogonia (GSG). Scale bar=50 μm. (b) Cyclin A2 IHC of testes from p53R172H/R172H and p53−/− mice irradiated with 2 Gy and sacrificed at 14 days and 21 days pIR. Scale bar=50 μm. (c) Quantification of the number of GSG: GSG were counted as number of cyclin A2 positive cells. Slides were scanned by VSViewer system and 20 views of × 10 images per slide were captured for the counting. The data were analysed by PRISM software and P-values were calculated by 1-way ANOVA. The horizontal bars represent ±s.d., **P⩽0.01, ****P⩽0.0001, ns, not significant.

