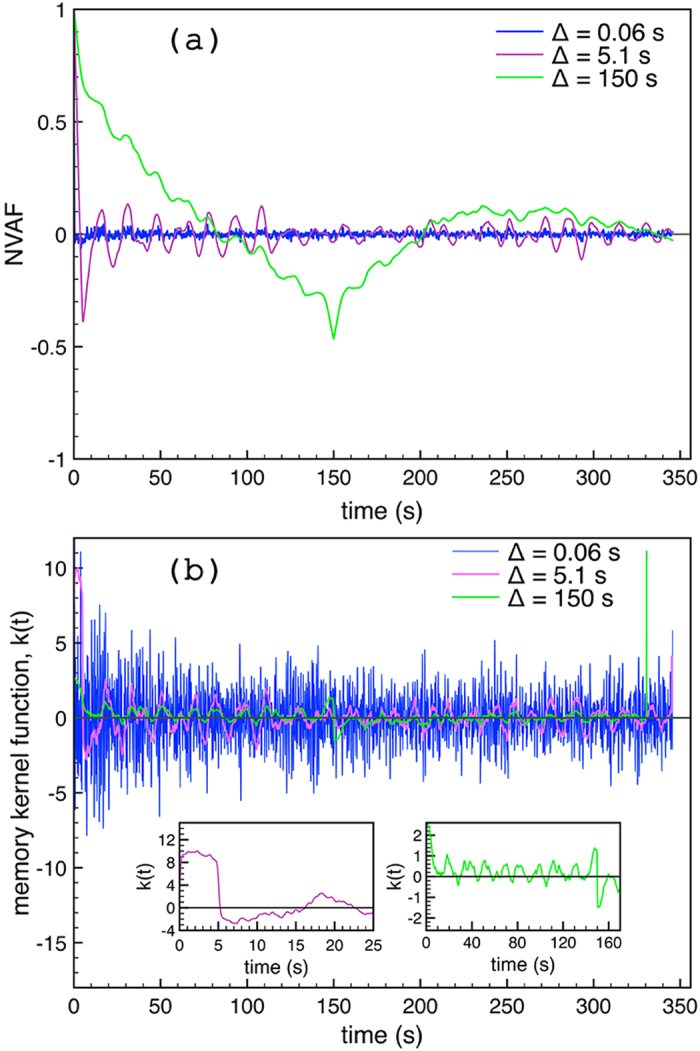
Figure 5.

The normalized velocity autocorrelation function (NVAF), v(Δ)(t)/v(Δ)(0), versus time t is illustrated in panel (a). Curves correspond to the minimum lag time 0.06 s (blue), a lag time of 5.1 s (purple), and a lag time of 150 s (green). Each lag time corresponds to a different scaling law in Fig. 4. For the same lag times, k(t) functions are illustrated in panel (b). The panel (b) contains two insets. Each inset shows the time dependence of the memory kernel for time moments a bit larger than the lag time for each case; at the left (purple) for lag time of 5.1 s, and at the right (green) for a lag time of 150 s.
