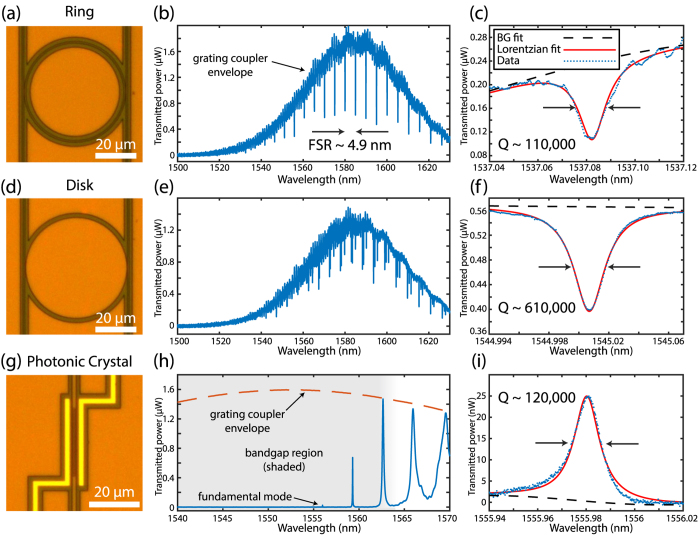
Figure 3. Transmission measurement results.
(a,d,g) Optical microscope images showing a microring, microdisk and photonic crystal respectively. For each structure, a spectrum of transmitted optical power vs. wavelength is shown (b,e,h). In (b) and (e) the Gaussian transmission window of the grating couplers is apparent, while in (h) the dashed-red line shows approximately the grating coupler envelope. The enlarged plots (c,f,i) show high-Q modes for each of the three structures. Loaded Q’s were calculated by fitting a Lorentzian function to the peaks/dips. The dashed black line shows a polynomial fit to the background.

