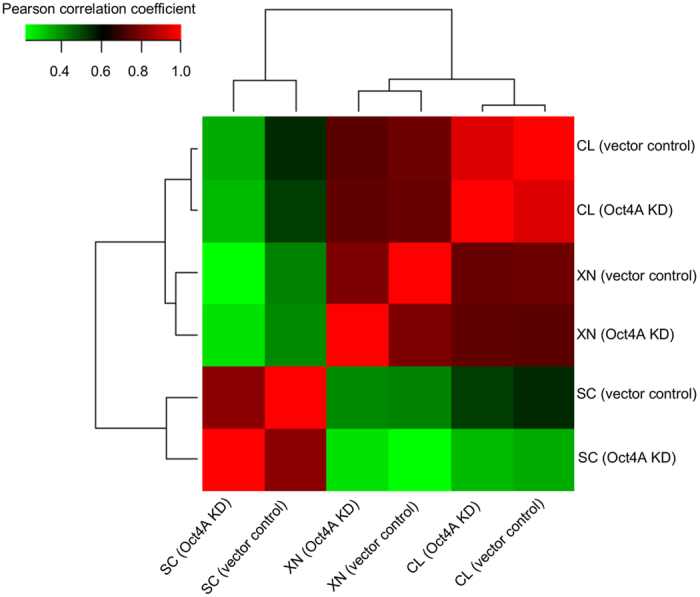
Figure 2. Characterisation of HEY Oct4A subsets reveal correlation between sample subsets in response to Oct4A expression.

Correlation matrix of cell lysates (CL), tumor xenografts (XN), and secretomes (SC) samples representing differential abundance based on normalised spectral count (SpC) values between HEY Oct4A KD and HEY vector control samples. Correlation expression profile reveals that each individual sample represents clear distribution and similarity with other sample subsets.
