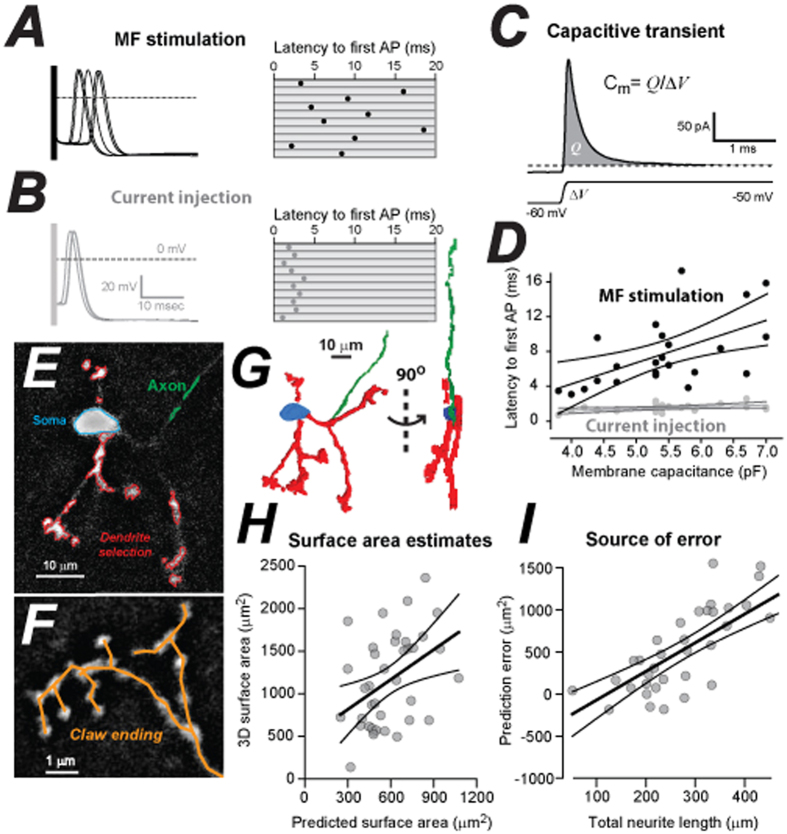
Figure 1. Evidence that cell size influences MF → CGC precision.
(A) Whole-cell current-clamp recording of APs generated following electrical stimulation of MF inputs onto a CGC in an acute slice preparation of the adult cerebellum. A series of voltage traces are superimposed and the latency to first AP is shown on the right hand raster plot for the first 10 responses. Failures have not been included. (B) Superimposed voltage traces of APs elicited following brief 1ms somatic current injection are shown for the same CGC as in (A). Note the longer latency and greater variability of APs elicited following MF stimulation compared to somatic current injection. (C) The whole-cell voltage-clamp configuration was used to generate an average current trace in response to a 10 mV step in the command voltage. The charge transfer of the brief capacitive transient (grey area) was used to calculate the membrane capacitance and to predict the total membrane surface area for each CGC. (D) Scatter plot of membrane capacitance versus mean latency to first AP for MF stimulation (black fills) and somatic current injection (grey fills). The linear regression and 95% confidence levels of the fit are shown. (E) A single confocal section of an adult CGC filled with biocytin following whole-cell recording, illustrating the use of a wild-fire algorithm to automatically detect the fluorescent signal associated with dendrites (red), soma (blue) and axon (green) for a single CGC. The flat area surrounding each detected region was used to estimate the surface area of 3D objects. (F) Smaller region of a single optical section showing digits within the claw of a single dendrite. The orange lines show the manual tracing method used to measure dendrite length. (G) A fully reconstructed 3D model generated from the CGC data shown in (E). This model was used to estimate the total surface area of the soma (blue), dendrites (red) and axon (green). (H) A scatter plot of the measured surface obtained from all 3D models versus the predicted surface area calculated from the capacitance current transient recorded from the same CGC. Superimposed upon this scatter plot are the linear regression and the 95% confidence levels. (I) A scatter plot of the prediction error (3D surface area minus the predicted surface area) as a function of the total neurite length (total dendrite length plus the total axon length) along with the linear regression and the 95% confidence levels for this fit.

