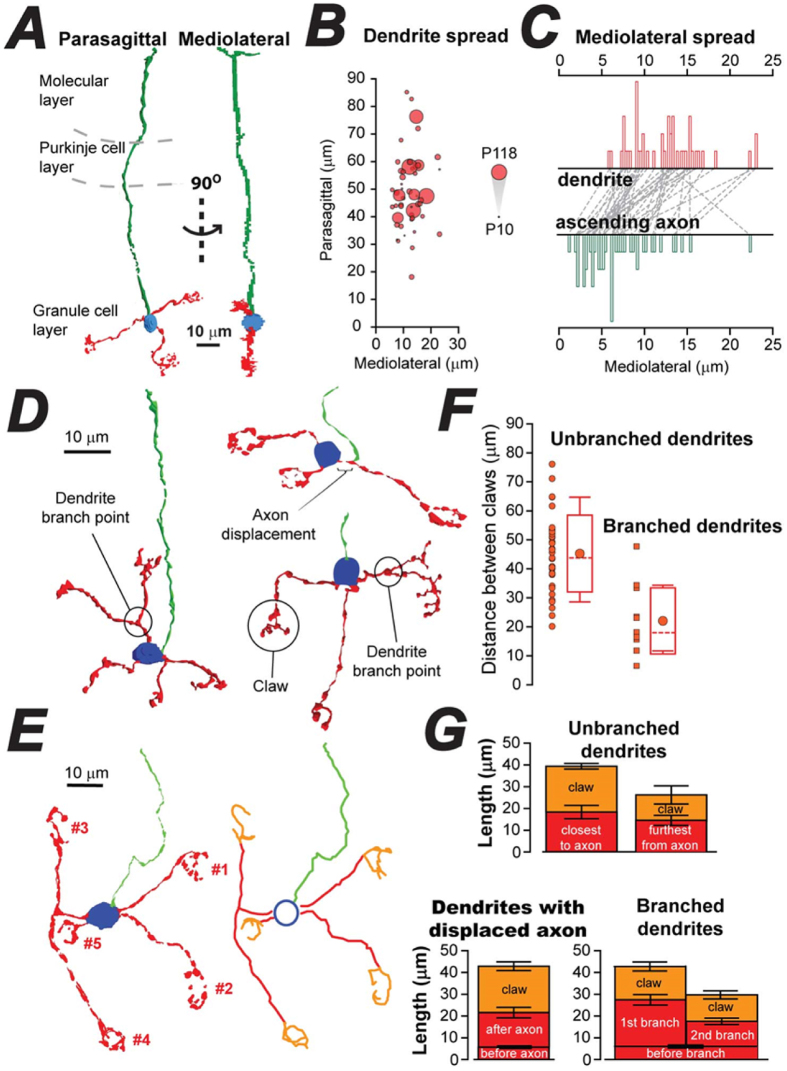
Figure 2. Quantification of CGC features that could impact on timing, coding and integration of MF inputs.
(A) 3D reconstruction obtained following confocal imaging of an adult CGC filled with biocytin during whole-cell recording. The parasagittal view of this cell (left) has been rotated by 90° to illustrate the narrow mediolateral spread of the axon and dendrites. (B) Bubble plot of data obtained for all CGCs plotting the relationship between the mediolateral spread versus the parasagittal spread of the dendrites for all CGCs. The size of the bubble indicates CGC age. (C) Histograms of the mediolateral spread for the dendrites (top histogram – red bars) compared to the mediolateral spread for the axon (bottom histogram – green bars). The dashed lines link the individual CGCs from which the latter two measurements were obtained. (D) Three representative examples of 3D reconstructions (≥P30) illustrating the presence of dendrite branch points and axon displacement. (E) Another example of a 3D reconstruction and the results of manual tracing of dendrites (red) and axon (green) for this cell with the length of the claw digits shown in orange. (F) Scatter plot of the Euclidian distance between claws found on unbranched and branched dendrites. The box and whisker plots beside each scatter plot depict the mean (circle), the median (dashed) values for each distribution, the standard deviation (box) and the 10% to 90% quartiles (whisker). (G) Bar charts depicting the average length of dendrite within the primary dendrite (red) and also the average length of all the digits within the claw. The top two bar charts compare these distances for unbranched dendrites closest and furthest away from the axon. The bottom left chart show the average values for the dendrite before and after the displaced axon and its associated claw. The right-hand bottom chart illustrates the average dendrite length before and after branch points of the type shown in (D). The error bars show the SEM.

