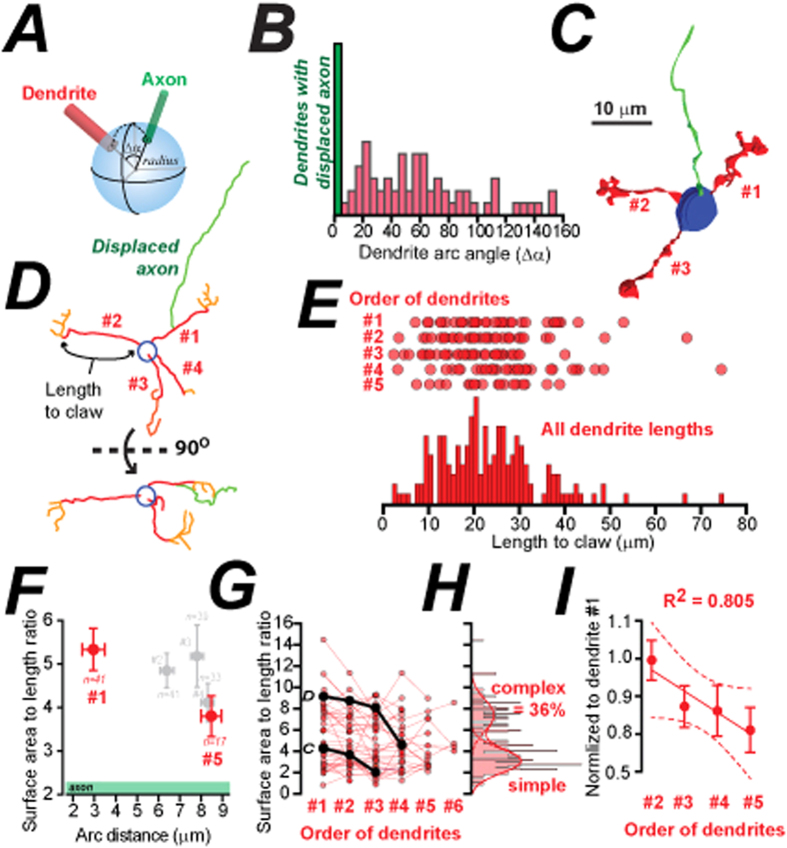
Figure 4. Establishing a relationship between dendrite complexity and axon location.
(A) Cartoon illustration of the method used to classify CGC dendrite order. (B) Histogram of dendrite arc angles measured relative to the axon for all dendrites (red bars) including the dendrites with the displaced axon (green bar). (C) 3D reconstruction from an adult CGC with dendrite order indicated. (D) Illustration of the z-tracing method used to obtain length measurements for dendrite before the claw (red), dendrite within the claw (orange) and the axonal length (green) for adult CGCs. (E) Plots of Euclidian distance between claws for branched and unbranched dendrites. Each circle is a single measurement. (F) Plot of the average surface area to length ratio against the average arc distance for dendrite #1 to #5. Dendrite #1 and #5 have been highlighted in red as these show the greatest difference in both of these parameters. The error bars depict the SEM values. (G) Scatter plot of all surface area to length ratio estimates (red circles) ordered from dendrite #1 to #5. The black circles show the results for the adult CGCs shown in panels C and D of this figure. (H) Histogram of all surface area to length ratio estimates (red bars) with the multiple Gaussian fits (red line) to the two discernable peaks of this distribution superimposed. The area under the curve for the two Gaussians was used to estimate the proportion of simple and complex dendrites on adult CGCs. (I) Surface area to length ratio data has been normalized to the first dendrite for each cell and the average data has been fitted with a straight line. The results of this linear regression analysis (solid red line) and the 95% confidence levels for this fit (dashed red lines) are shown.

