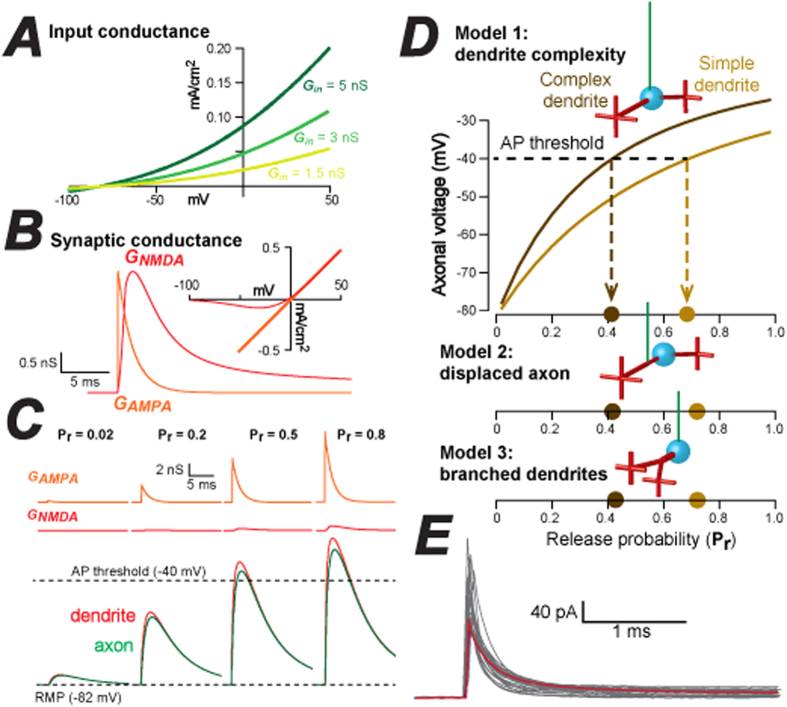
Figure 5. Demonstration that MF inputs onto complex dendrites have a greater impact on CGC excitability.
(A) A series of three current-voltage (I-V) relationships used to simulate different CGC input conductance levels using the Goldman-Hodgkin-Katz equation to produce open rectification of the input conductance. (B) Illustration of the conductance waveform profiles used to mimic AMPA-type (orange trace) and NMDA-type (red trace) postsynaptic conductance changes in CGC models. The I-V relationship for the AMPA and NMDA component of the postsynaptic response are also shown. A linear Ohmic relationship is used to mimic the AMPA-type synapse whereas a more complex Boltzmann function is used to mimic the voltage-dependent Mg2+ block that is characteristic of an NMDA-type postsynaptic response. (C) Illustration of how increasing the release probability leads to a larger AMPA and NMDA-component of the postsynaptic conductance change and therefore, influences the magnitude of the EPSP using a single synapse on CGC model 1. The bottom traces compare the voltage change produced at the dendrite (red) and axon (green), illustrating the small degree of filtering introduced by CGC morphology. (D) Plots illustrating the relationship between the peak axonal voltage and the release probability at a synapse located on the simple and complex dendrite of model 1, 2 and 3. The dashed lines indicate the voltage at which an action potential (AP) would be initiated in a typical CGC indicating how AP threshold would be reached at a lower release probability for a synapse located on the complex dendrite compared to a synapse on the simple dendrite. (E) Simulated capacitance transient from model 1 (red trace) is superimposed onto all capacitance transients recorded from the cerebellar granule cells used for morphological analysis in this study. Note the similarity.

