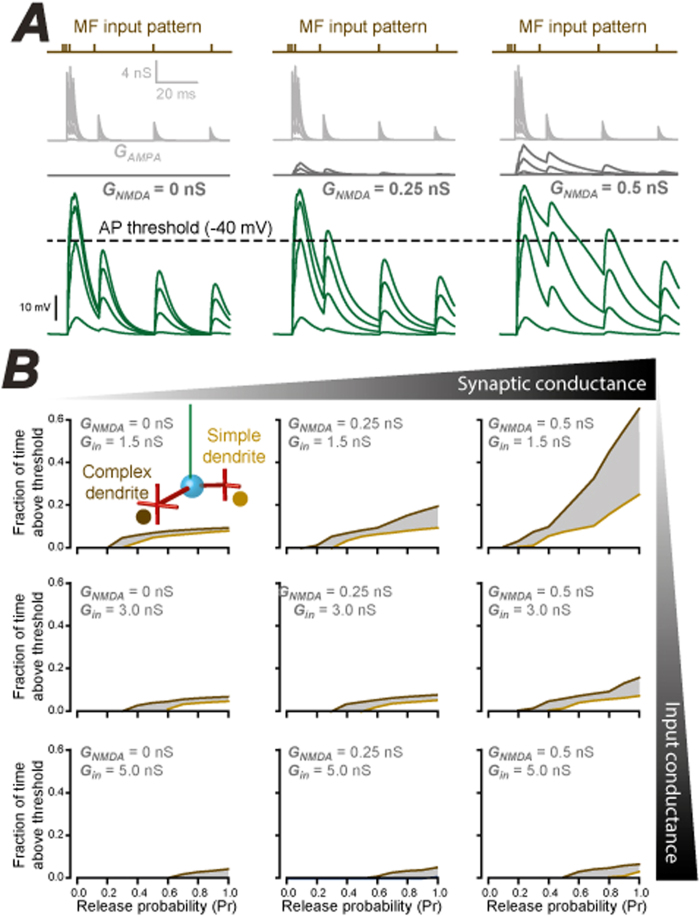
Figure 6. Influence of dendrite complexity, synaptic drive and inhibition on MF coding.
(A) The MF input pattern chosen in these simulations (brown top traces) was based upon in vivo measurements of MF bursting patterns (Rancz et al. 2007)10. The resulting simulation of the AMPA and NMDA conductance (grey traces) is shown with the peak NMDA component increasing from 0 to 0.25 and 0.5 nS (left to right). The bottom traces (green) show the resulting voltage responses indicating the time spent above the AP threshold for CGCs (dashed line). (B) A series of plots quantifying the fraction of time that the membrane voltage spends above AP threshold when the MF input pattern (see Fig. 4) is delivered to either the simple (light brown) or complex (dark brown) dendrite at increasing release probabilities. The top left panel illustrates the results of this simulation when the input conductance of the CGC is set to 1.5 nS and the peak conductance of the NMDA component of the synaptic response is set to 0 nS. The NMDA component of the synaptic conductance is then increased from 0 to 0.25 and 0.5 nS from left to right, whereas the CGC input conductance is increased from 1.5 to 3.0 and 5.0 nS as the panels move from top to bottom. These results were obtained for model 1, with identical results obtained for model 2 and 3.

