FIG. 8.
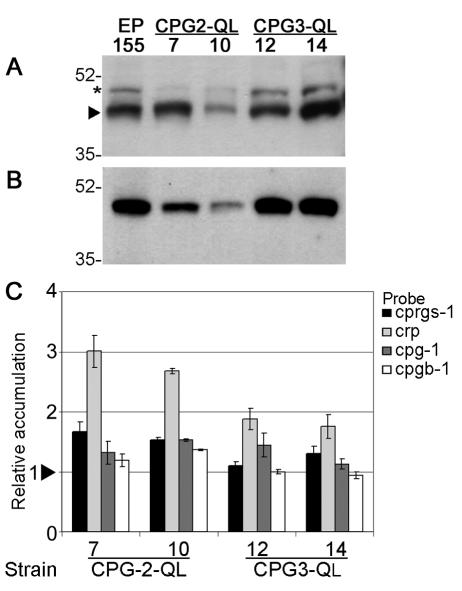
Real-time RT-PCR and Western blot analysis of gene and protein expression in strains expressing constitutively activated CPG-2 (Cpg-2-QL-7 and -10) or constitutively activated CPG-3 (Cpg-3-QL-12 and -14). (A) Western blot analysis of CPG-1 protein accumulation in wild-type strain EP155 and strains expressing constitutively activated CPG-2 or constitutively activated CPG-3. The arrow indicates the bands corresponding to CPG-1. The asterisk indicates a slower-migrating band that cross-reacts with α-CPG-1 antibody (40). (B) Western blot analysis of CPGB-1 protein accumulation. (C) Transcript accumulation of cprgs-1, cryparin (crp), cpg-1, and cpgb-1 in strains expressing CPG-2-QL or CPG-3-QL. Values are relative to accumulation in wild-type strain EP155. The arrowhead represents the reference value of 1.0 for EP155, calculated as described in Materials and Methods. Bars represent standard error for each data set.

