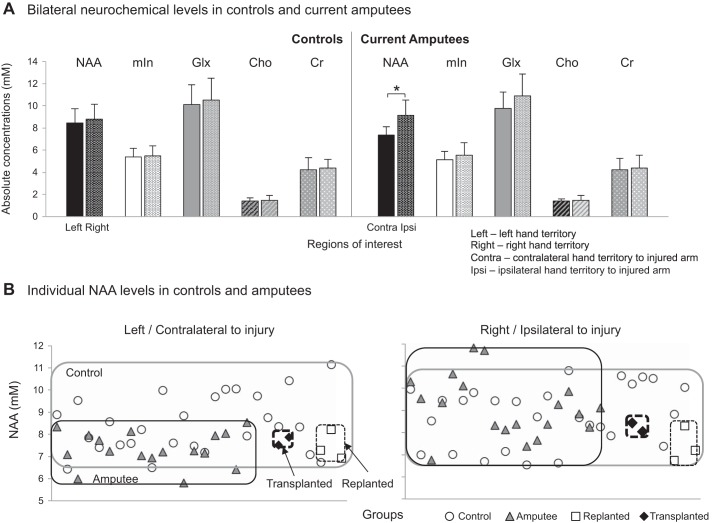
Fig. 2.
A: mean + SD levels of NAA (black), mIn (white), Glx (light gray), Cho (patterned-line gray), and Cr (patterned-dot gray) in left and right hand sensorimotor territories in control group and in contralateral and ipsilateral territories in current amputee group. In amputees, NAA levels are significantly lower in contralateral vs. ipsilateral hand territory (P < 0.001). B: individual NAA levels in controls (○) and current (gray triangles) and former (replanted, □; transplanted, ◆) amputees in both left/contralateral and right/ipsilateral territories. The gray rectangle delimits data for all controls, the black rectangle delimits current amputees, the thin dashed rectangle delimits replanted, and the bold dashed rectangle delimits transplanted.

