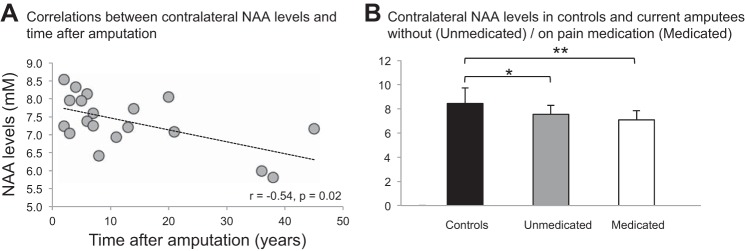
Fig. 3.
A: correlation between NAA levels in the contralateral hand sensorimotor territory and time after injury. Line indicates the statistically significant r (P < 0.05). B: mean + SD levels of NAA in left territory in control group (black) and contralateral territory in current amputees without (unmedicated, n = 10, gray) and with pain medication (medicated, n = 9, white). Note that NAA is significantly lower in both subgroups relative to control group (unmedicated, P = 0.01; medicated, P = 0.001). *P < 0.05, **P < 0.01.

