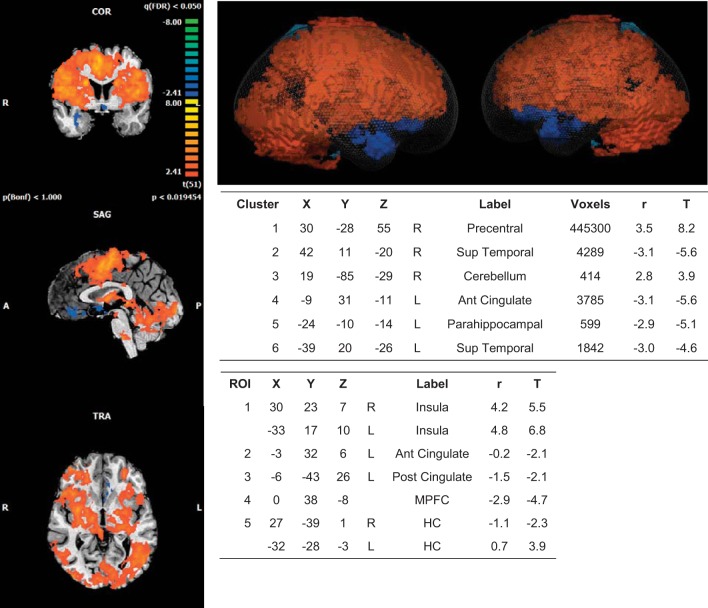
Fig. 3.
BOLD imaging results: heart rate regressor. Whole brain 2D (left) and 3D (glass brain; top right) representations of activated clusters. Peak cluster (top table) and region of interest (ROI) details (bottom table) are given with Talairach coordinates. R, right; L, left; Sup, superior; Ant, anterior; Post, posterior; MPFC, medial prefrontal cortex; HC, hippocampus. r, correlation value; T, t score (β value). Spherical ROI represents nearest gray matter 257 voxels (same for all ROIs). FDR, P < 0.05. Cluster threshold = 10 voxels.

