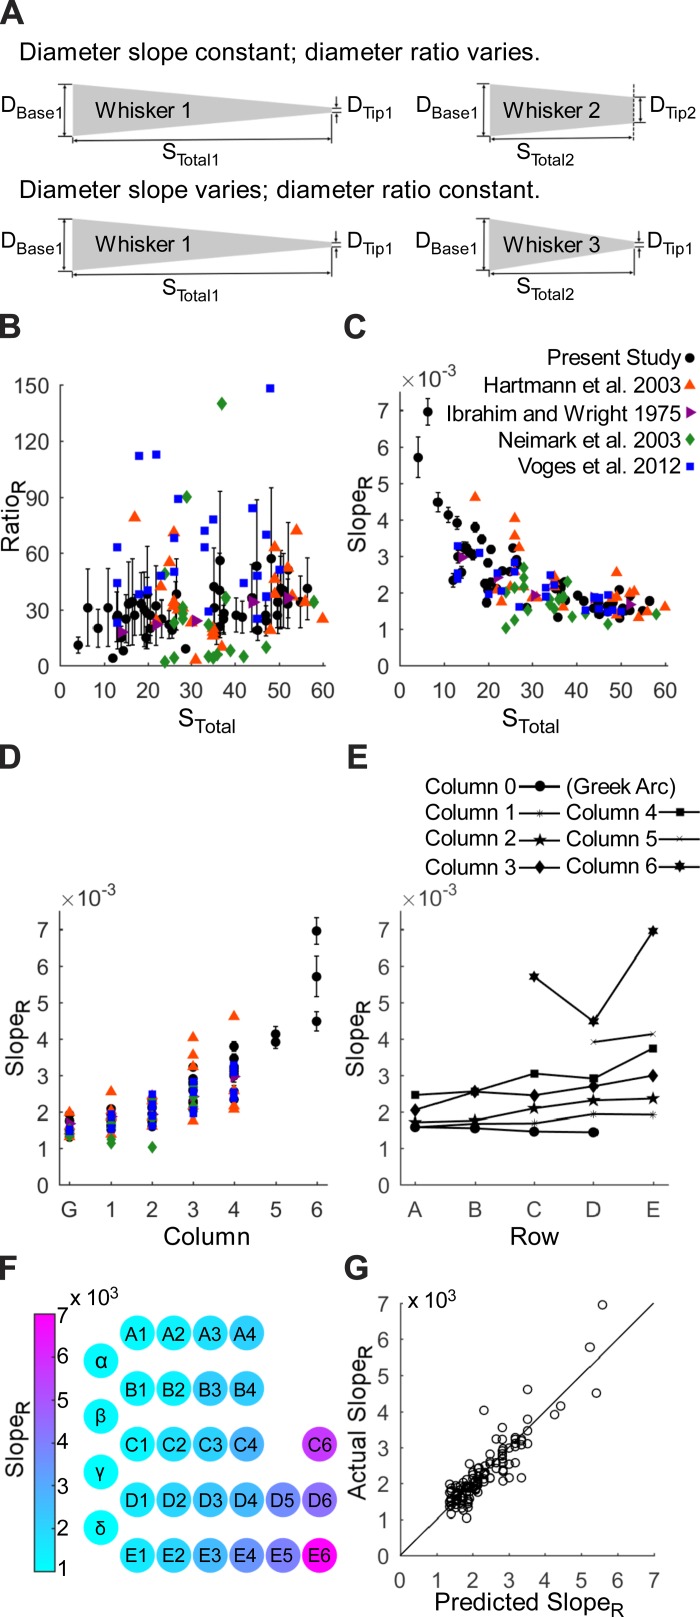
Fig. 5.
Quantification of radius ratio (RatioR) and radius slope (SlopeR) as functions of whisker arc length. B–G use data from all 122 whiskers across the 5 studies of the meta-analysis, with error bars computed via propagation of error. A: two parameters are required to define the geometry of a whisker. The top schematic illustrates that two whiskers with the same SlopeR can have very different RatioR. The bottom schematic illustrates that two whiskers with different SlopeR can have the same RatioR. B: the RatioR (RBase/RTip) is extremely variable and does not exhibit a strong relationship with arc length (STotal). RatioR is extremely sensitive to changes in the radius of the whisker tip, which can vary considerably due to wear, damage, and barbering. Error bounds vary greatly. C: SlopeR [(RBase − RTip)/STotal] is larger for shorter whiskers than for longer whiskers. Error bounds are much smaller than those calculated for RatioR. D: SlopeR increases with column position from caudal to rostral. E: within each column, SlopeR tends to increase slightly from dorsal (row A) to ventral (row E). F: schematic of SlopeR as a function of both row and column position across the array shows a strong trend by column and weak trend by row. G: the best prediction for SlopeR (Eq. 7) is linear with row and quadratic with column. The diagonal line represents the relationship where actual SlopeR = predicted SlopeR.

