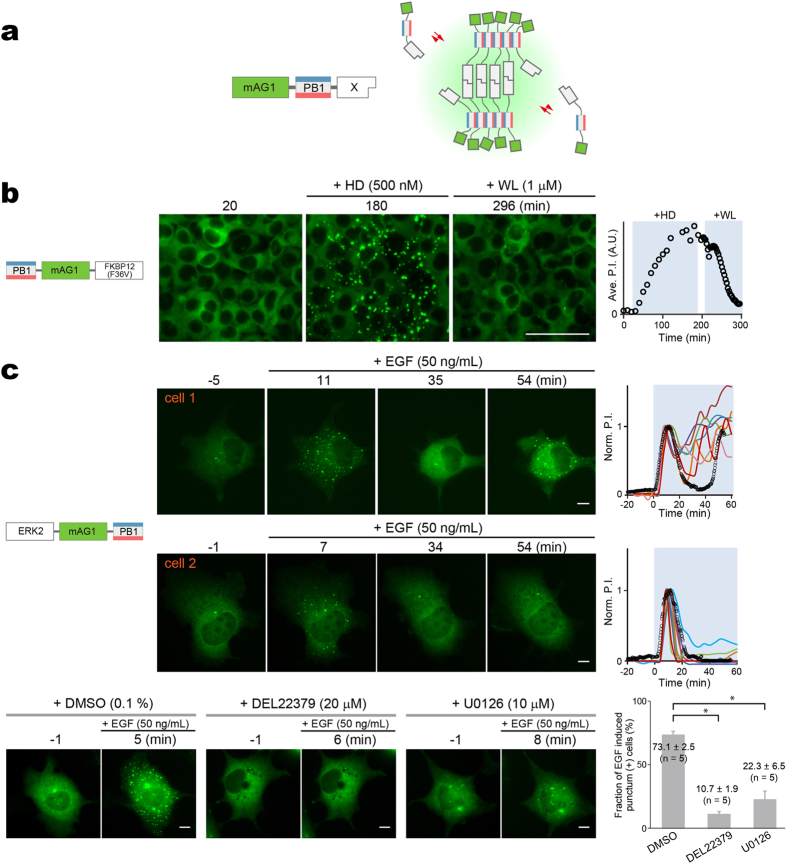
Figure 6. HomoFluoppi using mAG1-PB1 tag for visualizing homo-dimerization.
(a) Schematic representation showing that due to the homo-dimerization of X, multiple mAG1-PB1-X molecules build crosslinks, resulting in the concentration of mAG1 fluorescence (green shading). (b) Pharmacologically regulated homo-dimerization of FKBP12(F36V) monitored in HEK293 cells that stably expressed PB1-mAG1-FKBP12(F36V). The homo-dimerization was induced by 500 nM HD and then blocked by 1 μM WL. Time points of image acquisition were counted after the observation was started. Puncta were segmented automatically, and cell number was counted manually. The time course of averaged P.I. is shown (rightmost). Scale bar, 100 μm. See also Supplementary Video 9. The experiment was performed in triplicate.(c) EGF-evoked homo-dimerization of ERK2 monitored in Cos-7 cells transiently expressing ERK2-mAG1-PB1. top, ERK2 homo-dimerization was quantified in 21 cells. Punctum formation was oscillatory in 9 cells and transient in 12 cells as represented by cell 1 (upper) and cell 2 (lower), respectively. Time points of image acquisition were counted after the addition of 50 ng/mL EGF. Puncta were segmented automatically. Despite heterogeneity of the temporal profile, initial punctum formation was observed 5–10 min after the addition of EGF. The time courses of P.I. normalized to the initial peak are shown (rightmost). Data points from cell 1 and cell 2 are indicated by black open circles. See also Supplementary Videos 10 and 11. bottom, Treatment of cells with DMSO, DEL22379, or U0126 for 30 min before the addition of 50 ng/mL EGF. Representative images are shown. Percentage of cells showing EGF-induced increase in P.I. in examined cells. Approximately 20 cells were observed in quintuplicate, and data are shown as mean ± s.e.m. Statistical significance (*p < 0.0001) was examined by Bonferoni’s multiple comparison test. Scale bars, 10 μm.

