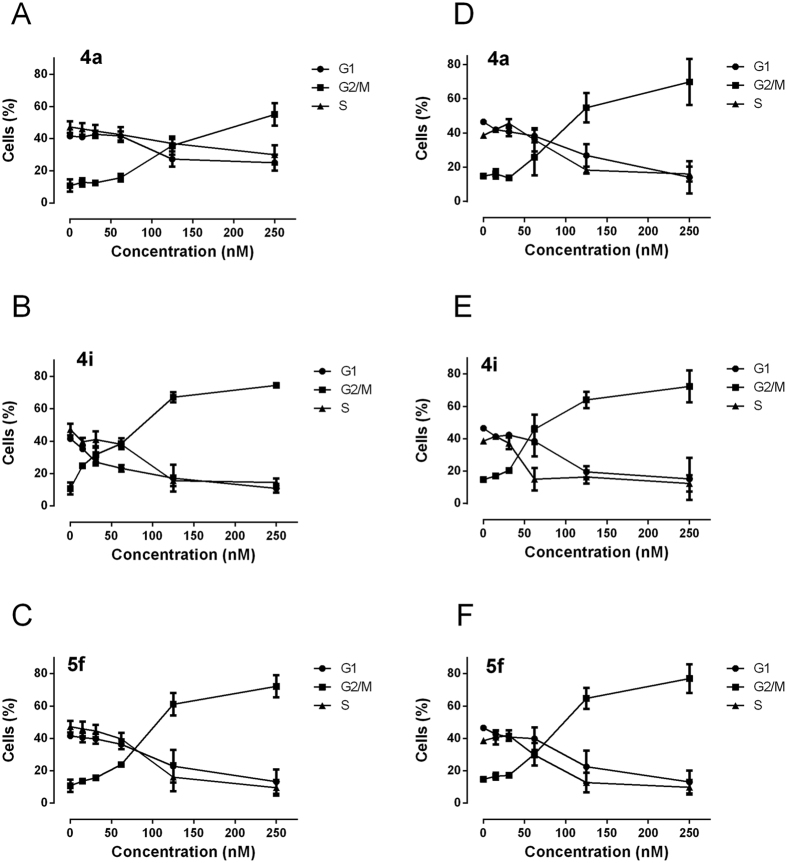
Figure 4.
Percentage of cells in each phase of the cell cycle in Jurkat (Panels A–C) and HeLa cells (Panels D–F) treated with the indicated compounds at the indicated concentrations for 24 h. Cells were fixed and labeled with PI and analyzed by flow cytometry as described in the experimental section. Data are shown as mean ± SEM of two independent experiments.

