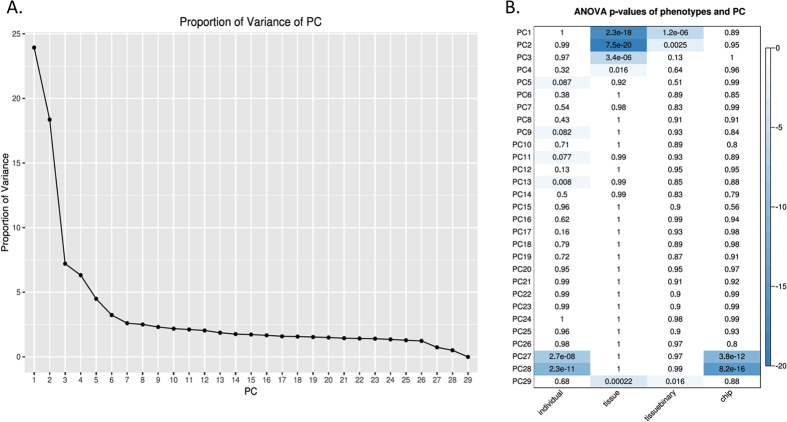
Figure 2. ANOVA analysis of principal components (PC) with sample traits.
(A) Scree plot showing the proportion of total variation in the dataset captured by each of the first 29 PC. (B) Significance of association between each PC and individual, tissue of origin, eye vs non-eye (tissuebinary), and array chip. The first 4 PCs show a significant association with tissue of origin as anticipated, whereas PC13 captures the majority of inter-individual variation.

