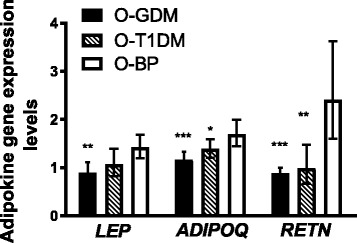
Fig. 3.

Adipokine gene expression levels in subcutaneous adipose tissue. Data is geometric mean (95% CI). All values are analyzed by independent samples t test after log transformation. All comparisons are to the O-BP control group. Levels are relative to the hypoxanthine-guanine phosphoribosyl transferase (HPRT) endogenous control gene. LEP: O-GDM, N = 58; O-T1DM, N = 60; O-BP, N = 42. ADIPOQ and RETN: O-GDM, N = 59; O-T1DM, N = 60; O-BP, N = 42. *p = 0.054, **p < 0.01, ***p < 0.001. Difference in LEP expression between O-T1DM and O-BP, p = 0.072. Black bars, O-GDM; striped bars, O-T1DM; white bars, O-BP
