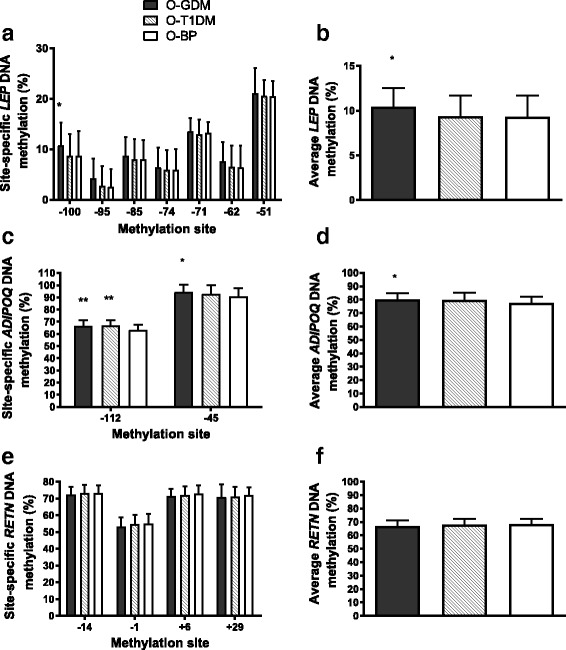
Fig. 4.

Site-specific and average DNA methylation for a, b leptin, c, d adiponectin, and e, f resistin in subcutaneous adipose tissue. CpG sites are denoted as the number of base pairs upstream (−) or downstream (+) from the transcription start sites. Data is mean ± SD and analyzed using independent samples t test. All comparisons are to the O-BP control group. *p < 0.05, **p < 0.01. Black bars, O-GDM; striped bars, O-T1DM; white bars, O-BP
