
Fig. 2.
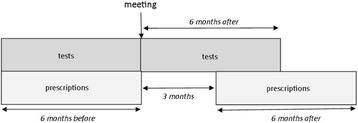
Graphical display of the periods defined for the baseline and follow-up measurement of tests ordered and drugs prescribed in the per protocol analysis
Official websites use .gov
A
.gov website belongs to an official
government organization in the United States.
Secure .gov websites use HTTPS
A lock (
) or https:// means you've safely
connected to the .gov website. Share sensitive
information only on official, secure websites.
Graphical display of the periods defined for the baseline and follow-up measurement of tests ordered and drugs prescribed in the per protocol analysis